It’s kind of an old hat to constantly dwell on getting the next 5 pounds of milk per cow. It’s easy to talk about, but how do you actually achieve it? Not very many people are brave enough to take you by the hand and show you exactly what it will take to get that next 5 pounds. That’s especially true if you are already making quite a bit of milk per cow.
Before we get to that, can I ask you some questions? Are you the kind of guy that checks the milk weigh slips every day? Do you record it somewhere in pounds per cow? What about your feed refusals? Do you check those? Do you write those down?
Reading the weigh slip is easy. Actually recording it every day as pounds per cow is an extra step – a step that often gets lost in the shuffle.
I’ll be honest; I don’t track daily milk weights either. Today’s milk weights won’t help you tomorrow. That milk has been made. The only thing that can help you for tomorrow is a record of dry matter intakes.
For the last four years, I have done a pretty good job at tracking daily dry matter intakes. I track them per pen, per cow and by weighted barn average. Tracking them has been a very solid predictor of what will happen tomorrow based on how the cows have been eating the past few days.
How I track
If you were to just figure out dry matter intakes per cow only once in awhile, you won’t have a very good reference of the good or the bad. Tracking that number daily has proven to be more important than tracking daily milk weights. Get the intakes right and the milk will take care of itself. Feeding to pen intake gives you more control over how the cows will milk tomorrow as opposed to tracking milk weights and trying to figure out what went right or what went wrong the day before.
Personally, I track dry matter intakes in a simple Excel spreadsheet.
Things like:
- Amount delivered per pen
- Number of cows in the pen
- Weigh-backs or refusals
- Dry matter of the mix
- Intake per cow
- The date
- The weather
Computerized feed programs like TMR Tracker, EZ Feed and Feed Watch will track all of this information for you too. I just mimic those in Excel without having the scale head scream, flash and blink at me while I am trying to mix a load. All of that information is fine and easy to track, but what do you do with it?
The most telling piece of information from your daily dry matter intake is using the average of them. When I talk about averaging, I am talking about the intake of one pen over several days. Not all of the pens for one day. I tried a seven-day running average, and quite frankly, seven days is just too long of a window to get a good handle on what is going on. Currently, I use a three-day average of each group’s intake. I like to compare the amount of dry matter being offered today with what that same pen has historically eaten the past three days on a per cow dry matter basis. Without some kind of spreadsheet or feed program, this step is easily left undone.
Dry matter trends
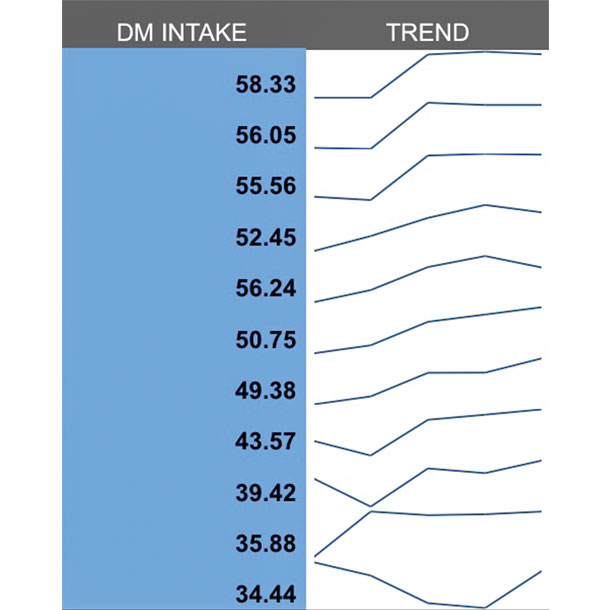
Numbers are fine, but sometimes they are hard to interpret. Being able to visualize the trend of each group has really helped me be much more accurate in feed delivery. For over a year now I have incorporated sparklines into my Excel spreadsheets to help spot dry matter trends much faster. If you are not familiar with sparklines, they are a tiny graph in a single cell. You can Google sparklines, and Google can show you how to implement them in any spreadsheet format.
Most feed programs have sets of dry matter intake graphs that you can use the same way. You can input your date parameters and instantly build a graph for the past week or few days to see the trend. This is very helpful when you have multiple groups of data on the same page.
Here is an example off of EZ Feed:
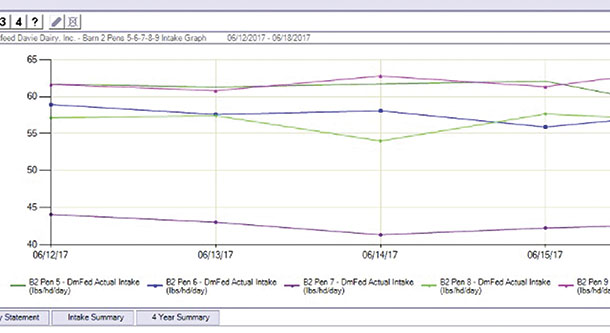
Click on the image above to view it in more detail.
Here is an example with Excel using sparklines:
My results
I was confident in my own results in using this system to feed to pen intake. I liked the visual aid, but I didn’t see any huge shifts in production per cow because I was already feeding to pen average long before I adapted the use of a dry matter trend chart in my feed program. I wanted others to test the concept in the real world.
I introduced the concept of feeding to dry matter trend on two different dairies in completely different environments than what we have in central Pennsylvania. I did a trial with Ryan Todd on his 160 cows in central Kansas. Within two weeks, Ryan saw a response of 6 pounds per cow. Our change? Feed to pen intake. Whatever the average of the last three days’ intake was, feed to at least that number. This really minimizes the human error of mixed groups, loading errors, dry matter changes and weather changes.
“For the first 10 days of April, both barns averaged 50.89 pounds of intake and 75.36 pounds of milk. For the last 10 days of April, they averaged 53.62 pounds of intake and 78.98 pounds of milk.” —Mike Blesy, Davie Dairy, Okeechobee, Florida
We also tried it in the harshest environment I know of – the heat and humidity of south Florida. Davie Dairy of Okeechobee milks 2,200 cows and was already doing an excellent job of tracking dry matter intakes and individual dry matter samples. After we started feeding to pen intake using a three-day average, they found 3.5 pounds of milk within a couple of weeks. Now with two months of practice, they are 10 pounds per cow ahead of this time last year. You know it’s hot in Florida this time of year, right? Gaining 10 pounds a cow in the Florida heat on 2,200 cows is no small task, especially in a two-month time frame.
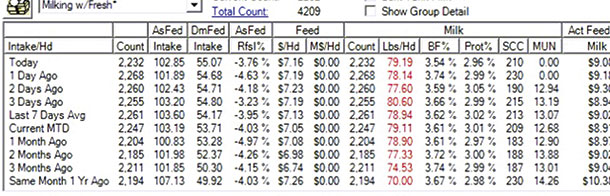
Click on the image above to view it in more detail.
Surely each farm’s results will be a little different. It’s pretty empowering to know that with a few small tweaks you can realize serious gains in milk per cow. I am not really great at math, so I need a system to work around that handicap. I am also not great at knowing what feed moistures are just by feel, so I need a system for that. I am terrible at remembering what I did yesterday, so I need a way to document my changes, progress and struggles. Using a systematic approach, like feeding to group intake instead of just throwing a dart at feed refusal, can put you on the right track to finding the next 5 pounds of milk. ![]()
To see more on how you can track your own dry matter intake trends, you can get the free template here on the Dairyhack website.

-
Jim VanDerlinde
- Dairy Producer, Consultant
- Hillview Dairy
- Lewisburg, Pennsylvania
- Email Jim VanDerlinde
PHOTOS 1 & 2: By converting the last three days of dry matter intake into a line graph, it is really easy to see which pens to push and which pens need attention as to why their intakes are slipping. Mixed groups and feeder error shows very quickly on these line graphs.
PHOTO 3: The cows at Davie Dairy in south Florida have shown a steady climb in both intake and production since implementing a system to consistently feed to pen intake using three-day averages. Photos provided by Jim VanDerlinde.


