The Farmers Union says U.S. dairy farm profits averaged about 3 cents per gallon between 2009-14. October margins started flat, but August fluid sales improved. Find those articles and other dairy economic news updates here.

Farmers Union: Dairy farm profits about 3 cents per gallon
Based on August 2016 price estimates from USDA, U.S. farmers and ranchers again received about 17.4 cents for every $1 spent by consumers for food at the retail level. More than 80 cents per $1 went for marketing, processing, wholesaling, distribution and retailing, according to the National Farmers Union.
A producer’s share of a gallon of fat-free milk, selling for $3.99 at retail, was $1.47, or about 37 percent.
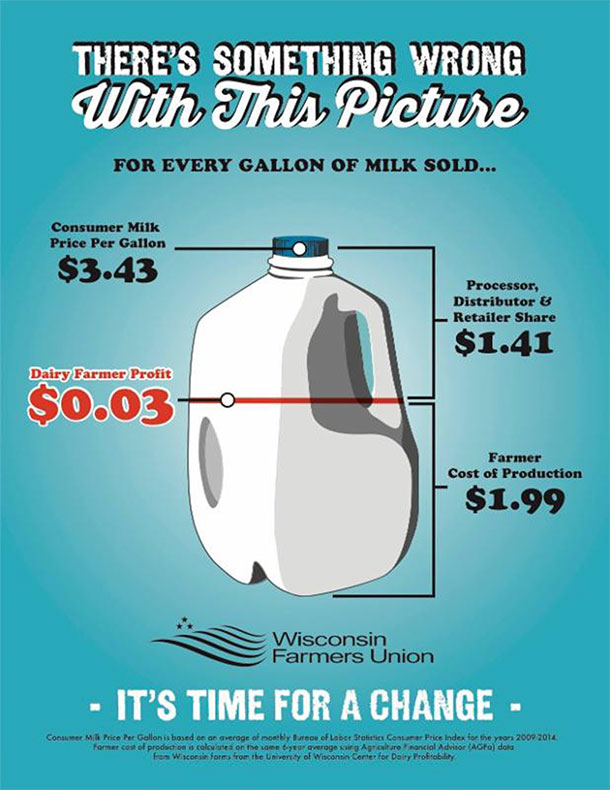
The Wisconsin Farmers Union also said dairy farmer profit from a gallon of milk sold at retail averaged 3 cents for the period of 2009 to 2014. Based on monthly price data from the Bureau of Labor Statistics Consumer Price Index, consumers paid an average of $3.43 per gallon, with the processor, distributor and retailer share taking $1.41 per gallon, and the farmer cost of production averaging $1.99 per gallon.
View the National Farmers Union latest Farmer’s Share infographic here.
August fluid milk sales improve
With schools back in session, fluid milk sales improved in August.
August 2016 packaged fluid milk sales totaled 4.13 billion pounds, up 2.1 percent from August 2015, according to USDA’s Dairy Market News. Sales of conventional products totaled 3.91 billion pounds, up 1.6 percent, while sales of organic products, at 218 million pounds, were up 13.6 percent. Organic represented nearly 5.3 percent of total sales for the month.
In the conventional aisle, whole and flavored whole milk sales outpaced last year’s sales. August sales of conventional whole milk were up 7.5 percent compared to the previous year, with flavored whole milk sales up 12.8 percent. Sales of organic whole milk were up 28.7 percent compared to a year earlier.
Conventional and organic fat-free milk varieties had the largest sales declines compared to a year earlier.
Year-to-date, total packaged fluid sales totaled 32.35 billion pounds, down 0.6 percent from a year earlier.
Conventional fluid milk sales totaled 30.65 billion pounds, down 0.9 percent from a year earlier. January-August organic milk sales total 1.70 billion pounds, up 5.5 percent. Organic sales represented about 5.3 percent of total fluid sales for the period.
The figures represent consumption of fluid milk products in federal milk order marketing areas and California, which account for approximately 92% of total fluid milk sales in the U.S.
Class I base down for November
The November federal milk marketing order (FMMO) Class I base price fell sharply, dropping $1.82 per hundredweight (cwt) from October. At $14.78 per cwt., it’s the lowest since July, and down $1.70 from a year ago.
FMMO Class I base ($ per cwt)
November 2016 – $14.78
October 2016 – $16.60
November 2015 – $16.48
January-November 2016 – $14.61
January-November 2015 – $16.30
Global Dairy Trade index slightly higher
The Global Dairy Trade (GDT) overall dairy product price index rose 1.4 percent during the latest auction, held Oct. 18.
Compared to the previous auction, prices were higher for anhydrous milk fat [+1.1 percent to $5,007 per metric ton (MT)]; butter (+2.6 percent to $3,984 per MT); buttermilk powder (+0.2 percent to $2,583 per MT); lactose (+5.6 percent to $780 per MT); and whole milk powder (+2.9 percent to $2,760 per MT).
Declining prices were seen for cheddar cheese (-3.7 percent, to $3,290 per MT) and skim milk powder (-0.3 percent, to $2,204 per MT).
The next GDT auction is Nov. 1.
Dairy Margin Watch: October starts flat
Dairy margins were flat to slightly weaker over the first two weeks of October, according to the latest CIH Margin Watch report from Commodity & Ingredient Hedging LLC. Feed costs rose slightly during the period, with nearby milk prices remaining depressed under the pressure of large stocks of dairy products.
Milk prices began to recover in deferred months. While spot fourth-quarter 2016 margins are now only average from a historical perspective, deferred margins through 2017 still hover between the 75th and 85th percentiles of the past 10 years.
The U.S. Department of Agriculture’s (USDA) October World Ag Supply and Demand Estimates report raised milk production forecasts for both 2016 and 2017 because cow inventories are growing more rapidly than previously expected. However, export forecasts were also raised, as increases in dairy prices from Oceania are expected to make U.S. products more competitive in world markets.
On the feed side, USDA forecast slightly lower corn yields, while raising that of soybeans. The corn changes were considered neutral to the market.
Visit the Margin Manager website.
Iowa-Nebraska dairy budgets improved in September
Iowa-Nebraska dairy margins improved slightly in September, according to a monthly summary from Robert Tigner, University of Nebraska Extension agriculture educator.
Compared to August, the total increase in gross income was 43 cents per cwt. Although milk component prices dropped in September, gross revenue increased because of the higher total pounds of protein and an improved producer price differential (PPD). While still negative, the PPD improved 75 cents than August. Butterfat revenue declined as well as income from cull cows.
Feed costs increased by 35 cents per hundredweight (cwt) of milk compared to August, with a 1-cent per bushel increase in corn and a $15-per-ton jump for alfalfa hay.
Tigner calculates dairy budgets for two production levels (20,000 and 24,000 pounds of milk per cow per year) and two management systems (freestall and tiestall barns).
The Iowa-Nebraska September average milk price was $17.32 per cwt.
• The breakeven price for a freestall herd with a 20,000-pound production average was $16.32 per cwt.
• The breakeven price was $14.58 per cwt for the freestall herd with a 24,000-pound average.
• The breakeven price for a tiestall herd with a 20,000-pound production average was $17.83 per cwt, the only system with costs higher than the actual milk price.
• The breakeven price was $15.88 per cwt for the tiestall herd with a 24,000-pound average.
Gap between U.S. and global dairy prices tightened
Relationships between U.S. domestic prices and international export prices have changed substantially in recent months, making U.S. products more competitive on the export market, according to the U.S. Department of Agriculture’s (USDA) latest dairy outlook report.
In June, the U.S. average wholesale price for butter, as reported by USDA’s Agricultural Marketing Service (AMS), was 89 cents per pound higher than the Oceania export price reported by AMS. By September, the gap had narrowed to 32 cents per pound.
The U.S. domestic wholesale price for nonfat dry milk (NDM) averaged about 5 cents per pound higher than the Oceania export price for January through August. In September, the Oceania export price was 19 cents higher than the U.S. domestic price. However, the gap may soon narrow; the average price of skim milk powder (SMP) fell by about 4 percent on the Global Dairy Trade auctions (GDT) on Oct. 4 and 18. Changes in GDT prices sometimes lead price changes in the broader global market.
One caveat: While rough comparisons of U.S. domestic prices and foreign export prices are useful, there are some issues in comparing these prices. Domestic prices are recorded when the product is shipped out and transfer of ownership has occurred; they do not include forward contracted prices. Foreign export prices are recorded when the prices are negotiated, with the product perhaps shipped in a later month. In addition, there are differences in U.S. NDM standards and SMP standards that may cause differences in price levels.
Lawmakers seek dairy aid provisions
Bipartisan U.S. House and Senate members are asking congressional and Obama Administration leaders to consider several measures to assist financially struggling dairy farmers.
The requests include:
• asking the Senate Appropriations Committee to provide assistance for dairy farmers in Fiscal Year (FY) 2017 government funding legislation. Part of that request is seeking elimination of any provisions preventing USDA from purchasing surplus dairy products under the Agricultural Adjustment Act of 1935 or the Commodity Credit Corporation Charter Act.
• calling for revisions to the Margin Protection Program for Dairy (MPP-Dairy) prior to the next federal Farm Bill. In addition, lawmakers asked for $3 million of the USDA National Agricultural Statistics Service (NASS) budget be designated for a survey of average feed costs by state. NASS estimates the survey will take 18-24 months, providing information on regional variation in feed costs. MPP-Dairy currently uses national average feed costs in calculating milk-feed cost margins.
• asking the Senate Appropriations Committee to explore the feasibility of refunding some of the MPP-Dairy premiums paid by dairy farmers.
Study highlights economic impact of Canadian dairy sector
Dairy Farmers of Canada (DFC) released an update of a regular study highlighting the important economic impact of the country’s dairy sector.
The study, conducted by EcoRessources and titled: "Update on the Economic Impacts of the Dairy Industry in 2015," which is the fourth update since 2009, has been conducted every two years.
Key findings of the study include:
• In 2015, the Canadian dairy industry contributed $3.8 billion in local, provincial and federal taxes.
• The sector's contribution to Canada's Gross Domestic Product (GDP) has increased from $15.2 billion in 2009 to $19.9 billion in 2015.
• In 2015, the sector sustained approximately 221,000 full-time equivalent jobs – an increase of approximately 3 percent since 2009. The types of jobs have also changed, with the number of jobs at the farm level decreasing, and the number of jobs at the value-added processing level increasing.
• Canada's overall milk production increased 6.71 percent between 2009 and 2015.
Ag Economy Barometer: Ag sentiment moderates in September
The Purdue University/CME Group Ag Economy Barometer indicated farmer sentiment improved modestly during September as fall harvest got under way across most of the U.S.
Based on a monthly survey of 400 agricultural producers, the Ag Economy Barometer includes indices on both current conditions and future expectations. Overall, agricultural producers are pessimistic about current conditions in agriculture, but continue to express some optimism regarding future economic prospects.
Survey respondents also continue to be more optimistic about future economic conditions in the livestock sector than in the crop economy, although most respondents don’t actually expect widespread good times in either sector.
Although expectations for long-term profitability in livestock declined among producers surveyed in September, their perspective on two key short-run indicators for livestock profitability improved.
Producers are surveyed quarterly regarding their expectations for beef cattle, farm-level milk and slaughter hog prices. Fewer survey respondents expect lower prices for beef cattle and milk than at any time in the last year. The September survey also revealed that fewer producers expect higher animal-feed ingredient prices.
Finally, the September survey indicates producers have a larger portion of their 2016 crop production unpriced than what is typical at this time of year, suggesting an expectation for positive crop storage returns among producers.
International dairy farm cost competitiveness shifting
Globally, 2015 proved to be one of the worst dairy economic years in recent decades, according to a new International Farm Comparison Network (IFCN) report. Although most dairy farmers around the world reduced production costs, a 33 percent decline in the global average milk price resulted in a serious drop in farm income.
“We are now in the third milk price crisis since 2007,” said Dr. Torsten Hemme, IFCN managing director. “This crisis and other factors have created the biggest shifts in dairy competitiveness I have ever seen in my entire career as dairy economist.”
Production cost reductions varied by country. While dairy farm economics are improving in Brazil and New Zealand with good or slightly increasing milk prices, things are getting more challenging in the U.S., European Union, China and India.
“Worst-hit dairy farmers in terms of profitability in 2015 were in Western Europe, North America and Oceania, where over 75 percent did not cover their full economic costs,” said Dr. Amit Saha, IFCN farm analyst. “In other regions the situation was less dire, with roughly 30 percent of farms not covering their costs.” ![]()

-
Dave Natzke
- Editor
- Progressive Dairyman
- Email Dave Natzke


