Growth in U.S. milk production is slowing, but it’s not for lack of cows. The USDA released its June 2017 Milk Production report on July 20, estimating total U.S. milk production up about 1.6 percent compared to June 2016. It’s the smallest year-over-year increase since July 2016.

USDA: June recap
Reviewing the USDA estimates for June 2017 compared to June 2016:
• U.S. milk production: 18.05 billion pounds, up 1.6 percent
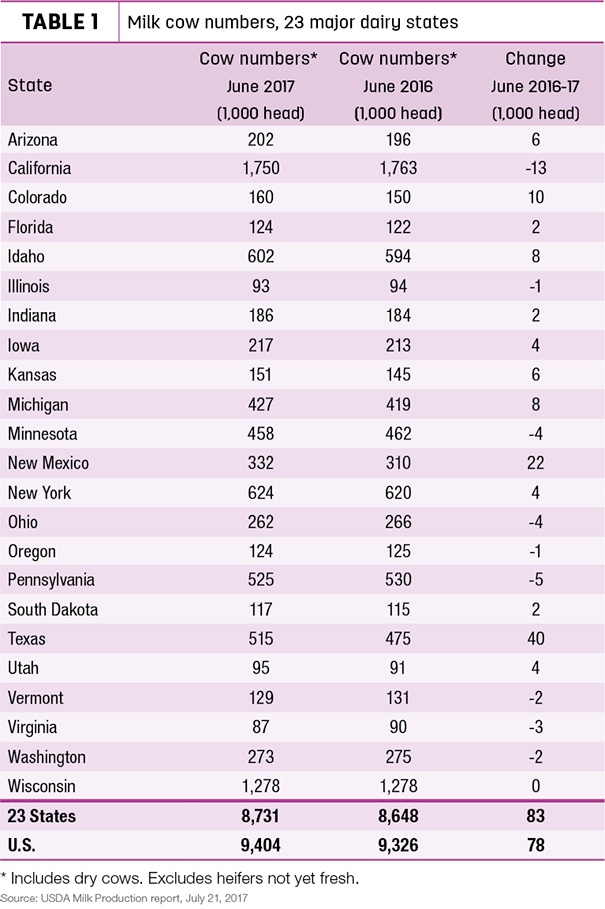
• U.S. cow numbers: 9.404 million, up 78,000 head
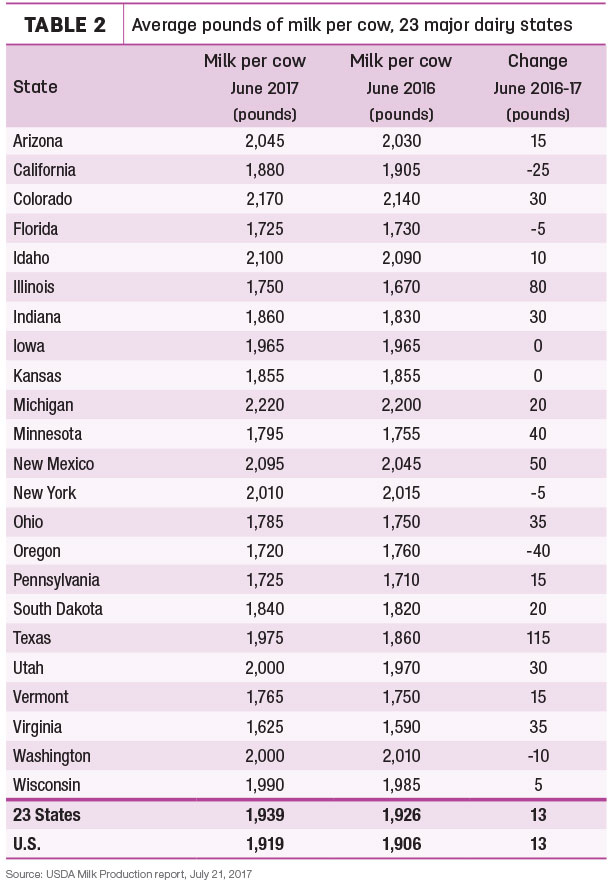
• U.S. average milk per cow per month: 1,919 pounds, up 13 pounds
• 23-state milk production: 16.93 billion pounds, up 1.7 percent
• 23-state cow numbers: 8.731 million, up 83,000 head
• 23-state average milk per cow per month: 1,939 pounds, up 13 pounds
Cow numbers increase
Nationally, milk cow numbers have now increased for nine consecutive months, dating back to last October. Based on preliminary June 2017 USDA estimates, U.S. dairy cow numbers were up 4,000 since May and up 78,000 head since June 2016 (Table 1). Compared to a year earlier, largest growth was in Texas (+40,000 head), New Mexico (+33,000 head) and Colorado (+10,000 head). California cow numbers were down 13,000 head, while Pennsylvania, Minnesota and Ohio posted declines of 4,000 to 5,000 head.
Milk per cow
But while cow numbers are up, minimal year-over-year gains in monthly milk output per cow are becoming a recurring theme. Reasons for the declines differ regionally, linked to lower feed quality, heat stress, the lingering effects of a harsh winter, too much or too little rain, or the loss of recombinant bovine somatotropin (rbST). In June, California, Florida, New York, Oregon and Washington saw output per cow shrink from a year ago (Table 2). Texas cows led all states in achieving year-over-year milk production gains, up 115 pounds from June 2016. Illinois June 2017 output was up 50 pounds per cow, while Minnesota was up 40 pounds compared to a year earlier.
Quarterly estimates
U.S. milk production during the April-June quarter totaled 55.3 billion pounds, up 1.8 percent from the same quarter last year. Milk cow numbers averaged 9.4 million head during the quarter; 29,000 head more than the January-March quarter and 76,000 head more than April-June last year.
Market fundamentals
In their monthly podcast, University of Wisconsin – Madison’s Mark Stephenson, director of dairy policy analysis, and Bob Cropp, dairy economics professor emeritus, said the slowdown in milk per cow, combined with strong dairy product demand evidenced by USDA’s July 24 Cold Storage report, provides some encouraging signs for dairy farmers. While still higher than a year ago, natural cheese inventories were drawn down in June, in part due to exports. In addition, strong demand for butter worldwide pulled U.S. stocks down about 1 percent from May 2017 and 5 percent below June 2016.
Stephenson and Cropp also touched on the surprising cheddar block-barrel price spread in their podcast. As of July 24, Chicago Mercantile Exchange (CME) block prices were at a 30-cent-per-pound premium to barrels. Stephenson noted blocks are finding their way to the export market, while increased barrel processing capacity and more than adequate milk supplies are contributing to barrel production and the wide and persistent spread.
Price outlook
Although July cheese prices have recovered some of June’s decline, Cropp has softened his milk price projections somewhat. Nonetheless, strong butter prices will provide support.
With the weakness of cheese and dry whey prices the end of June and first part of July, the Class III price for July (to be announced on Aug. 2) will decline to about $15.55 per hundredweight (cwt). But relatively strong butter prices are more than offsetting lower nonfat dry milk prices and should boost the July Class IV price to near $16.75 per cwt.
After July, both the Class III and Class IV price should start to increase again. If the year-over-year increase in monthly milk production stays below 2 percent and exports continue to improve, milk prices will strengthen. If that’s the case, Cropp estimated the Class III price could be back to near $16.50 per cwt by August, reaching the low $17s for October and November, resulting in an average of $16.45 to $16.75 per cwt for the year. That would compare to $14.87 per cwt in 2016.
The August Class IV price could be near $16.60 per cwt, rising into the $17s September through November, and averaging $15.90 to $16.10 per cwt for the year. That compares to $13.75 per cwt in 2016.
Semi-annual cow/heifer survey
Based on cattle inventories at the beginning of the year, the U.S. dairy herd had the capacity to grow to the highest level in more than two decades. The USDA’s semi-annual estimate of dairy cows and heifers seems to bear that out.
As of July 1, USDA estimated the number of dairy cows calving in the past year at 9.4 million head, up about 51,000 head from Jan. 1. (There were about 9.416 million cows in U.S. herds on Jan. 1, 1996.) Dairy replacement heifers weighing more than 500 pounds were estimated at 4.2 million on July 1, 2017, down 50,000 from Jan. 1.
The semi-annual USDA survey covers both beef and dairy cattle operations, surveying about 48,000 cattle producers in June and July. The mid-year report does not provide estimates for individual states. Due to budget constraints, the USDA did not conduct a mid-year cattle survey in 2016.
Dairy cow slaughter shows slight uptick
With the larger herd, the pace of dairy cow culling is slightly ahead of last year, according to monthly USDA data. For June 2017, federally inspected milk cow slaughter was estimated at 236,700 head, 13,000 more than June 2016. June 2016 and 2017 both contained 22 weekdays and four Saturdays. Through the first six months of 2017, cow slaughter was estimated at 1.495 million, about 46,100 more than the same period a year earlier. ![]()

-
Dave Natzke
- Editor
- Progressive Dairyman
- Email Dave Natzke


