More U.S. dairy cows are working, and they’re more productive than ever. However, continuing a two-year trend, they again brought home less money in 2016.

The USDA’s annual Milk Production, Disposition and Income report, released each April, estimates U.S. cow numbers, milk and milkfat production, volume of milk marketed, prices and cash receipts from milk sales in all 50 states for the previous year. Commentary about 2016’s data follows.
National numbers
In an industry measuring productivity in pounds and hundredweights, the industry’s economic impact adds up to billions of dollars.
U.S. dairy farms are employing the most cows in about two decades. The annual average number of milk cows on U.S. farms in 2016 was 9.328 million head, up about 14,000 head from 2015.
Milk production per cow in 2016, at 22,774 pounds, was 378 pounds more than 2015.
Compared to a year earlier, U.S. 2016 milk production increased to 212.4 billion pounds, and milk marketings (including whole milk sold to plants and dealers and milk sold directly to consumers) totaled 211.4 billion pounds, both up 1.8 percent from 2015.
The USDA estimated about 1 billion pounds of milk were fed to calves or used at home in 2016, up 3.3 percent from a year earlier.
Total 2016 U.S. milkfat production was estimated at 8.05 billion pounds compared to 7.81 billion pounds in 2015. On a per-cow basis, annual milkfat production averaged 863 pounds in 2016, up 23 pounds from 2015’s average of 840 pounds. The average milkfat test was 3.79 percent in 2016, up from 3.75 percent in 2015 and 3.74 percent in 2014.
Milk, fat prices lower plus returns were down
The U.S. average return on 2016 milk marketings was $16.34 per hundredweight (cwt), down 5 percent from the 2015 average of $17.21 per cwt and down nearly 32 percent from the record high of $23.97 per cwt in 2014.
With weaker dairy product prices, the value of milkfat took a hit. Milkfat returns averaged $4.31 per pound in 2016, down from $4.59 per pound in 2015 and $6.44 in 2014, a two-year decline of $2.13 (33 percent).
Click here or on the image above to view it at full size in a new window.
Reflecting the milk and milkfat price declines, total U.S. cash receipts from milk marketings fell to $34.54 billion in 2016, down from $35.73 billion in 2015. Milk used on the farm was valued at about $151 million both years.
The two-year downturn is especially acute in that it followed two years (2013-2014) when U.S. cash receipts from milk marketings were the highest on record: $49.35 billion in 2014 and $40.28 billion in 2013.
Returns per cow, herd
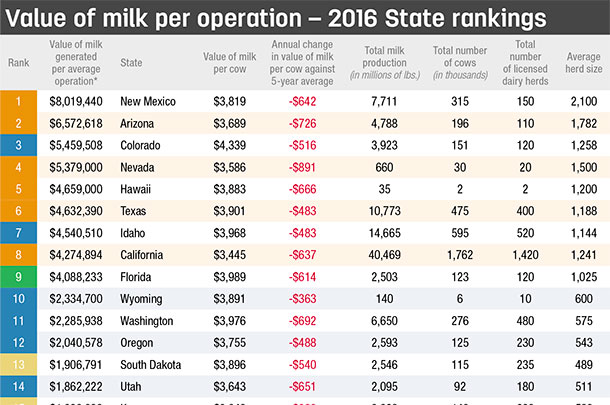
Progressive Dairyman calculated the value of milk marketed averaged $3,721 per cow in 2016, $133 less than the year before and the lowest since 2010. It was $1,637 less than the record high of $5,358 per cow returned in 2014.
Looking ahead
The 2017 dairy economy is looking slightly brighter than in 2016, although the picture is getting cloudier. As of late April, the USDA projected an all-milk price in the range of $17.40 to $17.90 per cwt (mid-range of $17.65 per cwt). With milk marketings expected to reach 216.3 billion pounds, that would yield gross receipts of about $38.18 billion or about $4,086 per cow, about $350 better than in 2016.
‘$1 billion club’
Ten states topped the $1 billion mark for annual milk receipts in 2016, unchanged from 2015. They included California, Idaho, Michigan, Minnesota, New Mexico, New York, Pennsylvania, Texas, Washington and Wisconsin. Arizona, Ohio and Iowa previously made the “$1 billion club” in 2014.
California and Wisconsin accounted for about $11.1 billion in 2016 cash receipts or about 32 percent of the U.S. total. Those two states alone saw a $5 billion drop in milk receipts between 2014 and 2016. ![]()

-
Dave Natzke
- Editor
- Progressive Dairyman
- Email Dave Natzke