Although the spring flush is moving north and regional milk processing capacity is again becoming a challenge, the number of U.S. plants manufacturing one or more dairy products (excluding fluid milk) is actually at a two-decade high.

There were 1,306 U.S. manufacturers producing one or more dairy products in 2017 (Table 1), up eight from 2016, up 25 in the past five years and the highest total since 1998, according to USDA National Agricultural Statistics Service’s annual dairy products summary.
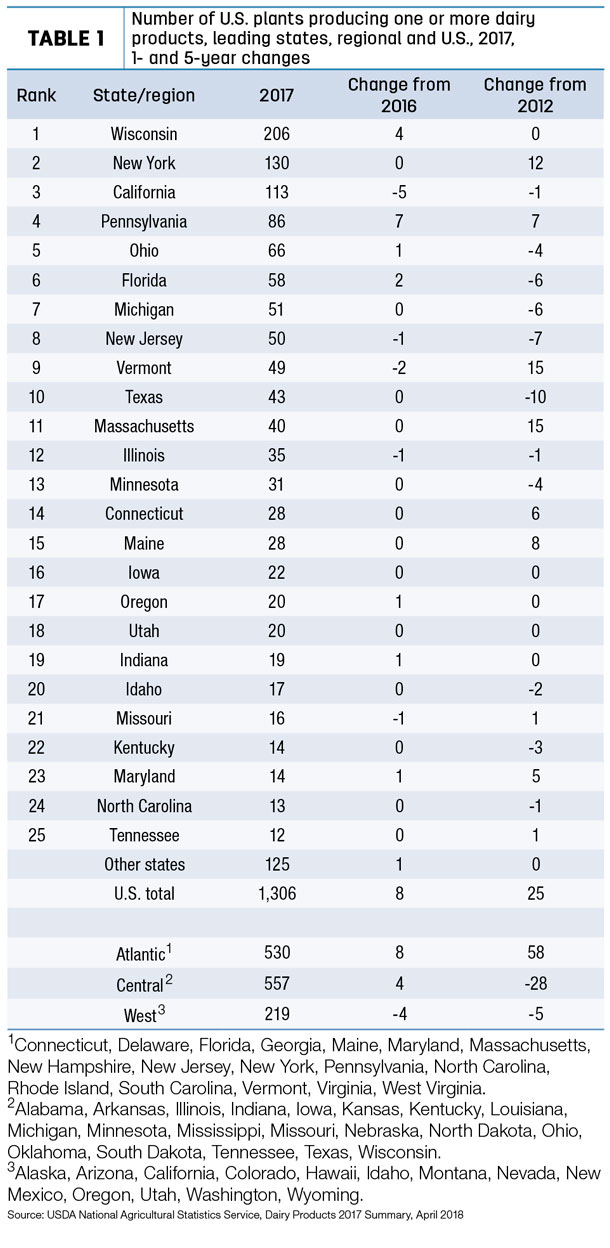
Wisconsin remains the leading home for dairy manufacturers with 206 plants, 132 of which produce cheese. Rounding out the top five states for total dairy plants were New York (130), California (113), Pennsylvania (86) and Ohio (66). California dairy plant numbers were down five from a year ago, while Pennsylvania plant numbers grew by seven. Wisconsin plant numbers grew by four.
U.S. dairy farms commercially licensed to sell milk declined by 1,600 (about 4 percent), from 41,819 in 2016 to 40,219 in 2017. In contrast, U.S. milk marketings increased from 211.4 billion pounds in 2016 to 214.5 billion pounds in 2017.
Dairy product summary
A look at product categories and individual state leaders follows:
• Cheese (excluding cottage cheeses) – The nation’s 563 cheese plants produced 12.7 billion pounds of cheese in 2017, 3.9 percent more than 2016. The number of U.S. cheese plants increased by 10 from 2016.
Wisconsin remained the nation’s cheese leader, with 132 plants producing a record 3.4 billion pounds of total cheese in 2017, 26.6 percent of the nation’s total. With 59 plants, California, the second-leading total cheese state in terms of volume, produced 2.5 billion pounds in 2017, virtually unchanged from the year before. On a volume basis, other leading total cheese-producing states were (in order): Idaho, New York, New Mexico, Minnesota and Pennsylvania. New York was second in the number of cheese plants with 63, producing 861 million pounds of cheese.
Wisconsin was the leader in the production of American-type cheeses, including cheddar, and total Italian cheese. However, California’s 28 mozzarella plants led that category, at nearly 1.5 billion pounds. Ohio retained its leadership in Swiss cheese production.
• Butter – The number of U.S. plants producing butter grew to 97 in 2017, up six from the year before. U.S. butter production during 2017 totaled 1.85 billion pounds, 0.4 percent above 2016. California was the leading state in butter production, with 13 plants producing 534 million pounds, 28.9 percent of U.S. production.
• Nonfat dry milk – California also led the nonfat dry milk category, with 11 plants producing 562 million pounds in 2017. The state’s plant numbers were unchanged, but production was down about 5 million pounds from 2016. Nationally, 51 plants produced 1.8 billion pounds of nonfat dry milk for human consumption, up 4.7 percent from 2016.
• Dry whey – U.S. production totaled just over 1 billion pounds in 2017, up about 8.6 percent from the year before. There were 31 plants in the U.S., led by Wisconsin, with 10.
• Yogurt – Production of plain and flavored yogurt rose slightly in 2017, to 4.5 billion pounds. New York had the most plants, with 39, and the most production, at 706 million pounds. California was second in both categories.
• Ice cream – New York and Ohio each had 31 ice cream (regular, hard) plants, with Pennsylvania at 30. However, California surpassed every other state in 2017 production of regular (hard) ice cream, at 106 million gallons. Pennsylvania was second, at 41 million gallons.
Download the full summary from USDA’s National Ag Statistics Service. ![]()

-
Dave Natzke
- Editor
- Progressive Dairyman
- Email Dave Natzke


