February’s Federal Milk Marketing Order (FMMO) uniform prices and producer price differentials (PPDs) weren’t markedly different from a month earlier, based on market administrator reports released the week of March 8.

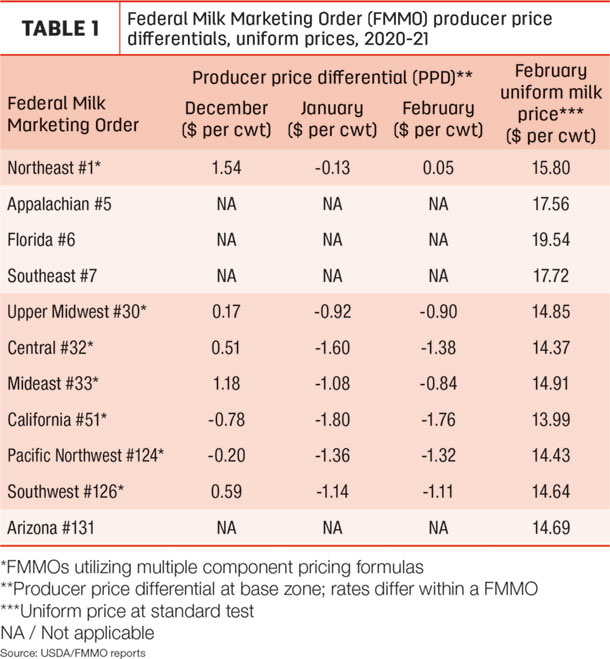
Changes in uniform or “blend” prices were mixed in a narrow range, while PPDs remained negative in six of the seven orders utilizing multiple component pricing. (Table 1).
February uniform prices at standardized test were down in all FMMOs outside the southeastern U.S., with prices below $15 per hundredweight (cwt) in seven FMMOs and dipping below $14 per cwt in the California FMMO. The January-February price declines ranged from 5-29 cents per cwt. Uniform prices at standardized test were up 13-28 cents per cwt in the Appalachian, Florida and Southeast FMMOs.
February prices for butter, cheese and nonfat dry milk powder (NDM), three of the four dairy products used to calculate FMMO class prices, were all lower than a year ago and last month, noted Calvin Covington, writing in his most recent Dixie Dairy Report. The fourth product, dry whey, continues to inch higher due to strong export demand. Dry whey is now over 50 cents per pound and the highest price in nearly four years.
The February 2021 Class III milk price was $15.75 per cwt, down 29 cents from January 2021 but above the Class I base price of $15.54 per cwt. The February 2021 Class IV milk price was $13.19 per cwt, down 56 cents from January. Although price changes were less volatile, the February Class III-Class IV price gap of $2.56 per cwt was the largest since November 2020.
Protein was valued at about $2.98 per pound in February, down about 6 cents from January 2021 and about a nickel less than February 2020.
PPDs still negative
February PPDs remained negative in six of seven applicable FMMOs, although not nearly as dramatic as those seen during most of the second half of 2020. The Northeast FMMO PPD moved into positive territory, albeit just a nickel.
PPDs have zone differentials, so they’ll vary slightly within each FMMO. In addition, PPD impacts on individual milk checks are based on individual milk handlers.
February levels of Class III milk utilization (Table 2) and pooling were also mostly steady with recent months, although volumes were down slightly due to fewer days in the month compared to January.
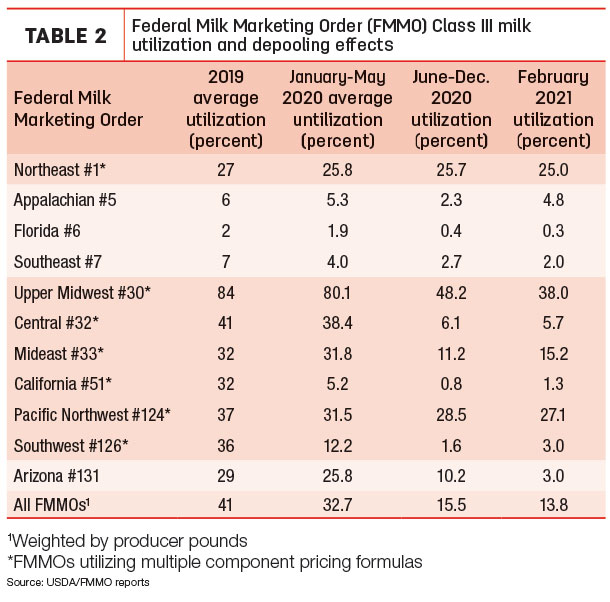
Class III pooling does remain below pre-coronavirus levels. Total Class III milk pooled across all FMMOs in February 2021 was about 1.35 billion pounds, down from 3.76 billion pounds a year earlier. Class III utilization was about 14% in February 2021, well below the 33% pre-COVID-19 average for January-May 2020. Class III utilization averaged about 41% in 2019.
Looking ahead
As a predictor of depooling, negative PPDs and the ”Class I price mover,” Chicago Mercantile Exchange (CME) futures prices indicate the gap between Class III-Class IV milk prices expands slightly in the second quarter of 2021 but then tightens somewhat into the first quarter of 2022. Based on CME futures prices at the close of trading on March 12, the Class III-Class IV price gap averages $2.28 per cwt in the first quarter of 2021, expands to $2.66 per cwt in the second quarter, closes to $1.99 per cwt in the third quarter and tightens further to $1.35 per cwt in the fourth quarter of the year. Markets are subject to change, of course.
In comparison, the 2020 Class III-Class IV price gap averaged $4.68 per cwt in 2020, with a low of 40 cents in January to more than $10 in July and November.