February 2019 U.S. milk production continued a five-month streak in which year-over-year growth was less than 1 percent. However, while cow numbers were down from a year ago, the January-February U.S. dairy herd increased about 6,000 head from December, ending a string of seven straight months of contraction. The increase came despite record-high dairy cull cow slaughter to start the year (see below).
Recent harsh winter weather throughout much of the Northwest and Upper Midwest may lead to lower milk production per cow in upcoming monthly reports.
February 2018-19 recap at a glance
Reviewing the USDA estimates for February 2019 compared to February 2018:
- U.S. milk production: 17 billion pounds, up 0.2 percent
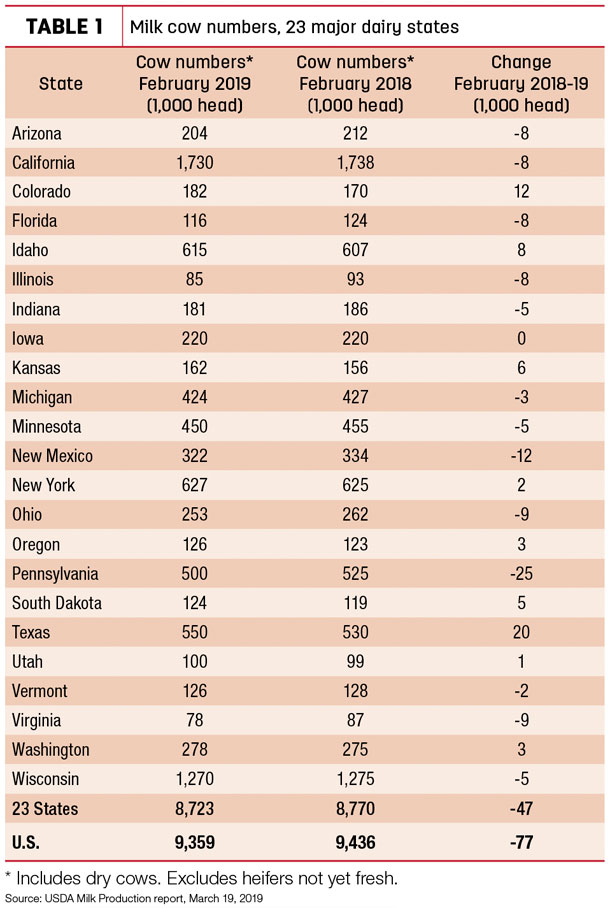
- U.S. cow numbers: 9.359 million, down 77,000 head
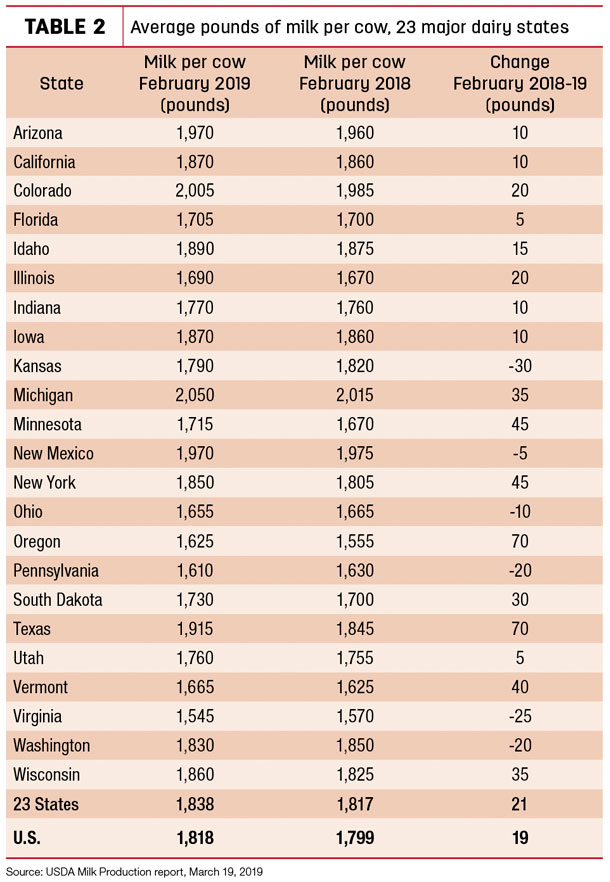
- U.S. average milk per cow per month: 1,818 pounds, up 19 pounds
- 23-state milk production: 16 billion pounds, up 0.6 percent
- 23-state cow numbers: 8.723 million, down 47,000 head
- 23-state average milk per cow per month: 1,838 pounds, up 21 pounds
Source: USDA Milk Production report, March 19, 2019
As of February 2019, nine states increased cow numbers compared to February 2018 (Table 1), led by a combined total of 40,000 head among Texas, Colorado and Idaho. Compared to a year earlier, Pennsylvania was down 25,000 cows, New Mexico was down 12,000, and Arizona, California, Florida, Illinois, Ohio and Virginia were each down 8,000 to 9,000 head. Michigan, Minnesota and Wisconsin were down a combined 13,000 head.
Among all major dairy states, February 2019 milk per cow increased less than 1 pound per day from February 2018. Output per cow saw the largest increases in Oregon and Texas (Table 2), partially offset by declines in New Mexico, Ohio, Pennsylvania, Washington, Virginia and Kansas.
By volume, February 2019 milk production was up 75 million pounds compared to a year earlier in Texas, a 7.7 percent increase. Wisconsin output was up 35 million pounds, up 1.5 percent. Idaho production was up 24 million pounds (+2.1 percent), but California was virtually unchanged, up just 2 million pounds (+0.1 percent). Pennsylvania led decliners, down 51 million pounds (-6 percent), and New Mexico was down 26 million pounds (-3.9 percent).
On a percentage basis, Colorado led all states, up 8.3 percent (28 million pounds) compared to February 2018. Oregon was up 7.3 percent (14 million pounds). Pennsylvania, Florida and Illinois saw declines of 6 to 7 percent, with Virginia down 11.7 percent.
The number of dairy herds in the U.S. averaged 37,468 in 2018, down 2,731 from the average of 40,199 dairy herds in 2017. Watch for the April 19, 2019, issue of Progressive Dairyman for our annual dairy statistics poster.
Cropp: Situation and outlook
Offsetting slower growth in milk production, ample cheese stocks, modest growth in domestic demand and reduced growth in dairy exports have kept milk U.S. prices from showing much improvement, Cropp said.
The Class III milk price was below $14 per hundredweight (cwt) in January and February. Some improvement in cheese prices should push that to nearly $15 per cwt in March, but cheese prices must average above $1.70 per pound to raise the Class III milk price to $16 per cwt, Cropp said.
As of the first day of spring, milk futures continue to show slow price recovery, with Class III reaching the mid-$15s in April-June and moving above $16 per cwt in July-November. Class IV milk price futures reach $16 per cwt in May, but don’t hit $17 per cwt through the end of the year. So while milk prices will improve in 2019, they will keep operating margins for dairy farmers tight until at least the last quarter of the year, Cropp said.
Beyond U.S. borders, milk production is expected to show only a modest increase in the European Union, be lower in Australia, and a possible drought in New Zealand could limit milk production there, Cropp noted.
February dairy cow slaughter levels high
U.S. dairy farmers continue to move dairy cull cows to slaughter at a record pace. Federally inspected milk cow slaughter was estimated at 278,900 head in February 2019, 19,200 head more than February 2018, according to the USDA’s Livestock Slaughter report. At 577,300 head, January-February 2019 slaughter is already nearly 27,000 ahead of the same period a year ago.
With three fewer weekdays and Saturdays, February’s total was down 18,600 head from January 2019, but averaged about 600 head more per day at 11,700 head.
Regionally, February 2019 dairy cow culling topped 72,300 head in an area including Illinois, Indiana, Michigan, Minnesota, Ohio and Wisconsin, and was about 66,000 head in Arizona, California, Hawaii and Nevada.
Federally inspected milk cow slaughter was estimated at 3.153 million head in 2018, up about 164,600 head (5.5 percent) from 2017. Annual dairy cow culling was higher only once in more than three decades – in 1986 during the whole-herd buyout program.
Global Dairy Trade index rises again
There has been some good news. The index of Global Dairy Trade (GDT) dairy product prices posted an eighth consecutive increase during the auction held March 19, up 1.9 percent.
Prices for all major product categories were mixed to mostly higher:
- Skim milk powder was down 2.4 percent to $2,405 per metric ton (MT).
- Butter was up 9.3 percent to $5,089 per MT.
- Whole milk powder was up 4 percent to $3,317 per MT.
- Cheddar cheese was up 3.9 percent to $4,036 per MT.
The next GDT auction is April 2, 2019.
April Class I base price slips
The April 2019 Federal Milk Marketing Order (FMMO) Class I base price is $15.76 per cwt, stubbornly holding under $16 for a sixth straight month. It is down 22 cents from March 2019 but $1.66 more than April 2018. Through the first four months of 2019, the Class I base price is $15.54 per cwt, up about $1.25 compared to the same period a year ago.
Dairy margins start March weaker
Dairy margins deteriorated slightly in the first half of March as lower milk prices more than offset the impact of cheaper feed costs, according to Commodity & Ingredient Hedging LLC.
The feed markets have been declining with weakness in both corn and soybean meal, as commodity funds build a record short position in the grain markets ahead of spring planting. This comes despite the fact that widespread flooding in the western Corn Belt from the recent “bomb cyclone” will likely delay spring planting across the region. ![]()

-
Dave Natzke
- Editor
- Progressive Dairyman
- Email Dave Natzke