APHIS: Determining U.S. milk quality using bulk-tank somatic cell counts, 2018
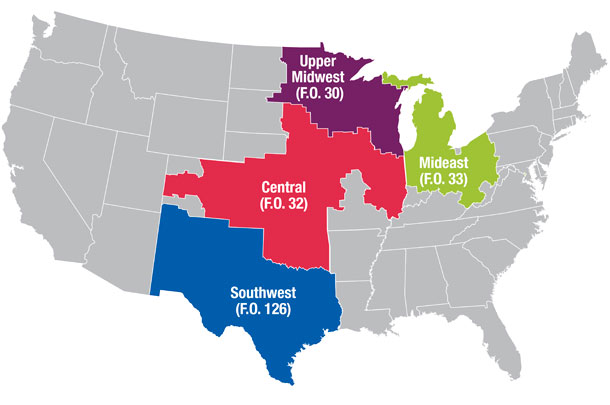
The APHIS Center for Epidemiology and Animal Health (CEAH), in conjunction with the USDA’s Agricultural Marketing Service (AMS) and the National Mastitis Council’s Milk Quality Monitoring Committee, monitor U.S. milk quality using data from bulk tank somatic cell counts (BTSCCs). Data are provided by four of the nation’s 11 FMMOs: Central, Mideast, Southwest and Upper Midwest. Six FMMOs do not collect BTSCC data, and the California FMMO did not go into effect until November 2018.
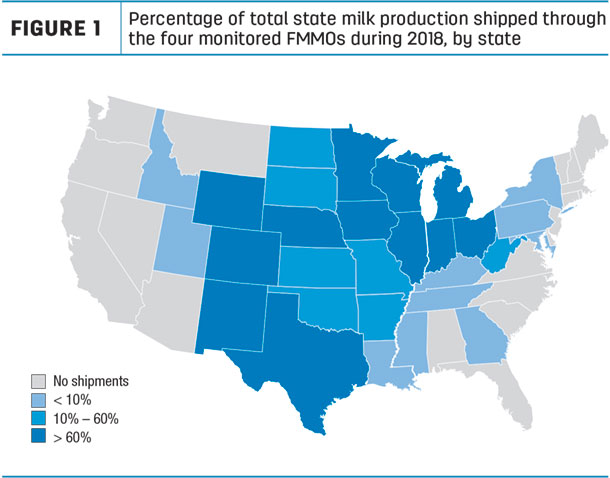
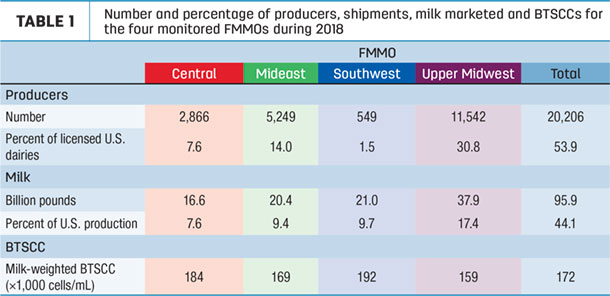
In total, the four FMMOs monitored milk from 20,206 producers (53.9% of U.S. producers licensed to sell milk that year). The monitored milk accounted for 95.9 billion pounds (44.1% of the 217.6 billion pounds of milk produced in the U.S. in 2018). Due to milk volumes, the results are weighted more heavily toward the Upper Midwest.
In 2018, the milk-weighted geometric BTSCC mean in the U.S. was 172,000 cells per milliliter, a decrease from 181,000 cells per milliliter in 2017.
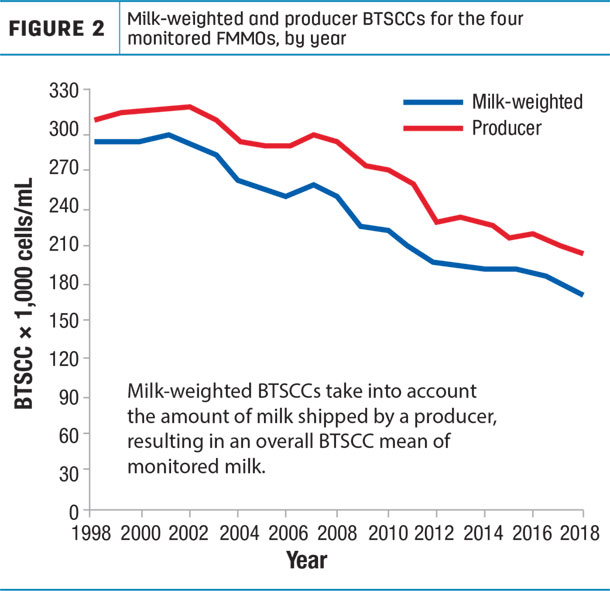
Milk-weighted BTSCCs take into account the amount of milk shipped by a producer, resulting in an overall BTSCC mean of monitored milk. The producer BTSCC – which is a geometric, non-milk-weighted mean of all shipments – was 206,000 cells per milliliter, a decrease from the 211,000 cells per milliliter calculated in 2017.
In 2018, the Mideast FMMO had a slight increase in BTSCCs, while the other three FMMOs had a decrease.
From 2013 through 2018, the percentage of total milk shipped with BTSCCs less than 200,000 cells per milliliter increased from 53.2% to 65% of milk shipped.
Monthly monitoring continues to show that BTSCCs peak during summer (June through September). In 2018, monthly milk-weighted BTSCCs were highest during August (193,000 cells per milliliter) and lowest in April (157,000 cells per milliliter). While BTSCCs generally peak during summer, the percentages of fat and protein in monitored milk were at their lowest values in summer.
Using the amount of milk shipped per month as a proxy for herd size, producers who shipped less than 500,000 pounds of milk per month had higher average milk-weighted BTSCCs during each month of 2018. Producers who shipped 5 million or more pounds of milk per month through the Southwest FMMO had the lowest weighted BTSCCs for all months in 2018. Producers who shipped from 500,000 to 4,999,999 pounds of milk per month through the Central, Mideast and Upper Midwest FMMOs had BTSCCs similar to producers who shipped 5 million or more pounds of milk per month.
The FMMO BTSCC levels are lower than somatic cell count (SCC) averages reported annually using Dairy Herd Improvement Association (DHIA) reports (see May 25, 2019 issue of Progressive Dairy). The 2018 average DHIA SCC was 191,000 cells per milliliter.
May 25 issue: In Focus: SCC another year of milk quality improvement
The DHIA data analyzes individual SCC for cows enrolled in DHIA herds across the U.S. All DHIA-enrolled cows are tested and included, even those that had milk withheld from the bulk tank. DHIA data also includes herds from the southeast U.S., which generally experience higher temperature and humidity values than herds in other parts of the country. ![]()