So while a four-decade decline in fluid milk consumption continued in 2018, overall U.S. per-capita dairy product consumption rose from the year before.
Annual USDA data shows 2018 U.S. per-capita consumption of dairy products (on a milk-equivalent, milkfat basis) increased 1 pound from the 2017 revised estimate, to 646 pounds (Table 1).
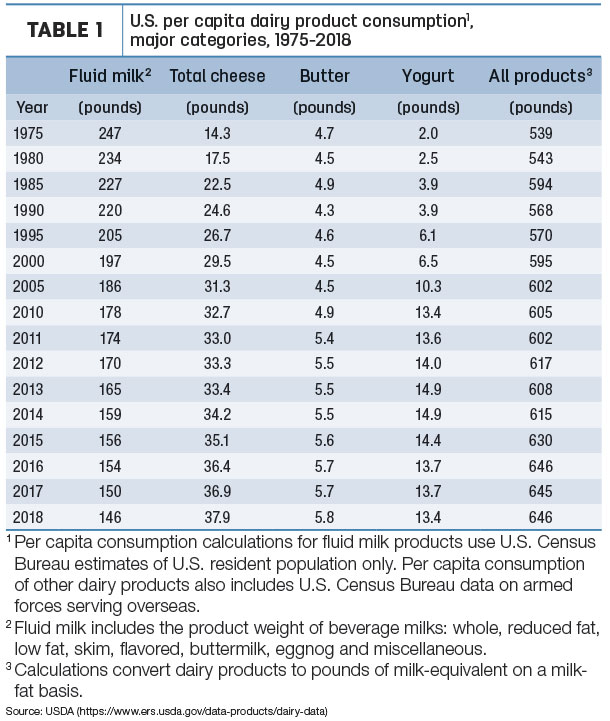
The small increase in 2018 reversed a 1-pound decline in 2017.
Per-capita dairy product consumption has jumped 38 pounds in the past five years, from 608 pounds in 2013 to 646 pounds in 2018.
Fluid milk continues slide
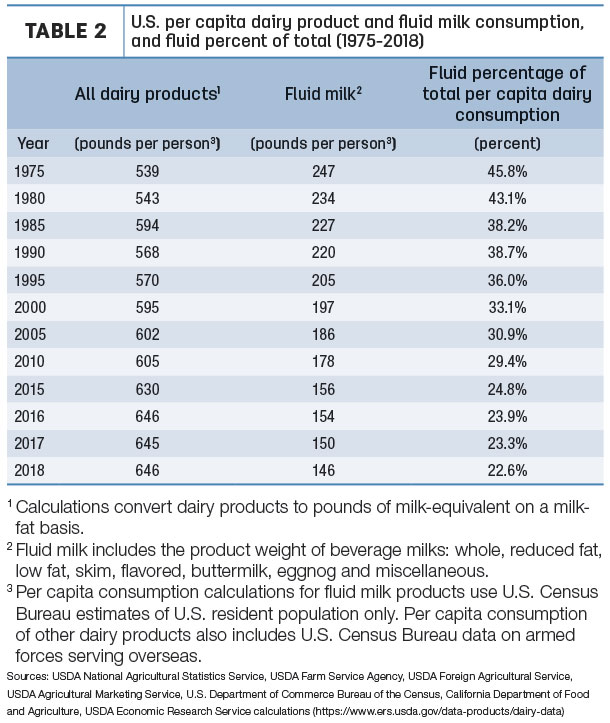
While overall per-capita dairy product consumption trended upward, consumption of fluid products has declined both in terms of volume and as a percentage of total dairy product consumption.
U.S. per-capita consumption of fluid milk was estimated at 146 pounds in 2018, down 4 pounds from 2017 and down more than 50 pounds in the past two decades. U.S. per-capita fluid milk consumption is now down more than 100 pounds since 1975, when it averaged 254 pounds. (The decline isn’t solely a U.S. phenomenon: Similar annual declines of 2% to 3% have been seen in western Europe, according to Rabobank. In contrast, developing markets, such as the Asia-Pacific region, have seen annual growth of 7% over the past decade.)
As a percentage of total U.S. dairy product consumption, fluid products have slipped from nearly 46 percent in 1975 to just over 22 percent in 2018 (Table 2).
In 2018, the decline in fluid milk consumption was offset by increased cheese and butter consumption (Table 1).
The milk equivalent of cheese consumption has been greater than fluid milk since the mid-1980s, and indications are 2018 U.S. cheese consumption (excluding cottage cheese) set another record high, at almost 38 pounds. American cheese consumption rose to about 15.4 pounds per person, up 0.3 pound, and consumption of other cheeses rose about 0.6 pound to 22.5 pounds per person. Per-capita consumption of cheese increased in 29 of the last 30 years and has declined only twice since 1975.
Per-capita consumption of butter (5.8 pounds) rose 0.1 pound in 2018. However, consumption of yogurt declined 0.4 pounds from 2017, to 13.4 pounds. It’s the fourth consecutive year yogurt consumption failed to post an increase.
Per-capita consumption of other dairy products was mixed: Regular and reduced-fat ice cream was down slightly, while consumption of dry whole milk and dry whey increased.
More turning to whole milk
Whole milk continues to be the bright spot in fluid consumption (Figure 1), with total sales volume up for a fifth consecutive year.
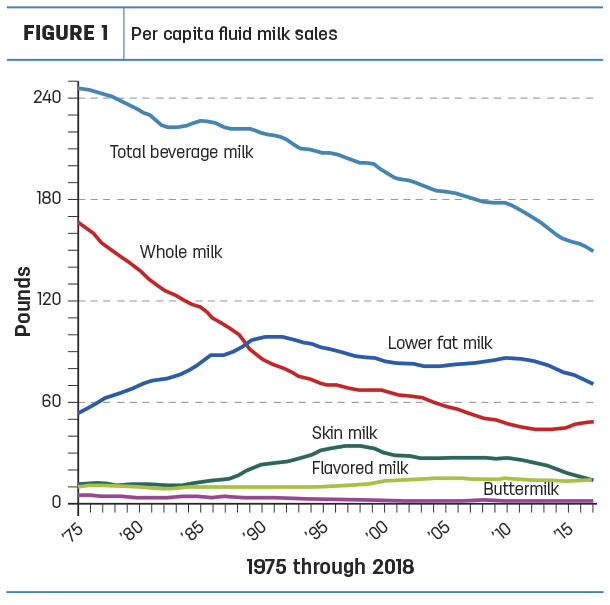
Total U.S. sales of whole milk topped 16 billion pounds for the first time since 2007. However, that increase wasn’t enough to offset sales declines in reduced-fat (2%), low-fat (1%) and skim milk.
Sales of flavored milk increased to a 13-year high in 2018 but that, too, was more than offset by declines in sales of other flavored milk varieties.
Total fluid milk sales in 2018, at 47.67 billion pounds, were down almost 1 billion pounds from 2017.
Organic milk represented about 5.5% of all fluid milk product sales in 2018.
The number of plants processing fluid milk in 2018 increased by 11, to 459, but the average milk volume per plant declined about 4.7 million pounds to 103.9 million pounds per year. ![]()

-
Dave Natzke
- Editor
- Progressive Dairy
- Email Dave Natzke
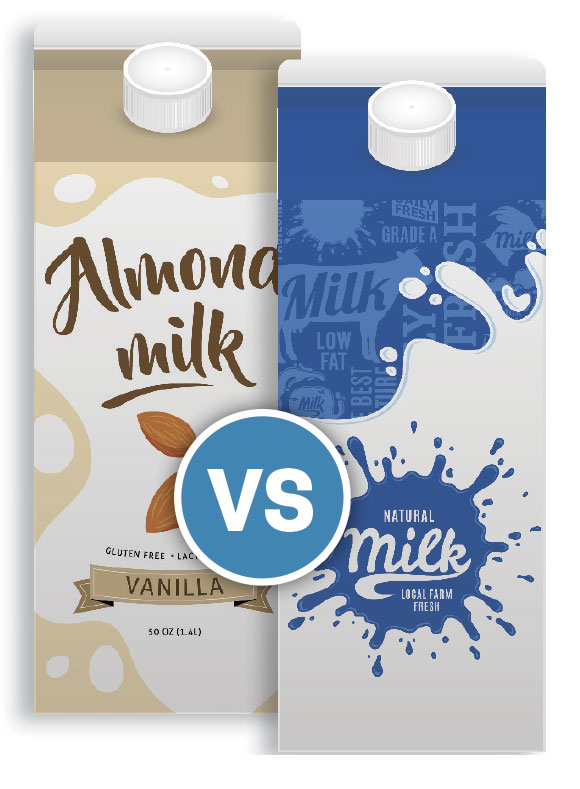
86% of U.S. adults prefer dairy milk
Despite the market inroads made by alternatives, a national tracking poll of 2,200 Americans shows 86% of U.S. adults prefer dairy milk over “other” beverages, including plant-based beverages. And a large margin of those surveyed want increased milk offerings in schools.
The online poll was conducted Aug. 16-18, 2019, by Morning Consult, a national survey firm, in partnership with the International Dairy Foods Association (IDFA).
Among other poll results:
- 10% prefer “other” beverages, a list that included plant-based beverages as well as lactose-free milk.
- 67% of adults across key demographics believe 2% and whole milk are the most nutritious types of milk.
- 42% of federal Supplemental Nutrition Assistance Program (SNAP) participants (336 of the 2,200 respondents) prefer whole milk for themselves or their families. SNAP participants also reported that they believe whole milk is the most nutritious (46%), the only demographic to do so.
- 77% of adults found it important to have a variety of options to choose from when purchasing types of milk.
Additionally, by a margin of more than 2 to 1, U.S. adults say it’s important to offer low-fat flavored milks with school meals; just 22% say they believe it is unimportant, and 29% had no opinion.
And, by a 3-to-1 margin, U.S. adults say it’s important to offer 2% and whole milk with school meals; 53% believe it is important that milks like 2% and whole are offered in schools, while just 18% feel it is unimportant. Currently, only low-fat 1% and skim milks are allowed in schools.