U.S. milk quality – measured in terms of somatic cell counts (SCC) – improved in 2017, according to the annual summary of Dairy Herd Improvement (DHI) test-day results.

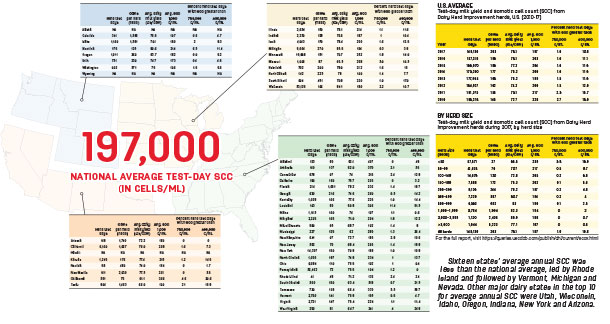
Nationally, average 2017 test-day herd SCC was 197,000 cells per milliliter, down 6,000 cells per milliliter from 2016 and the largest year-to-year improvement since 2011-2012, according to the Council of Dairy Cattle Breeding and the USDA’s Animal Improvement Programs Laboratory.
Test-day data from all herds enrolled in DHI somatic cell testing during 2017 (98.7 percent of all DHI herds and 97.1 percent of DHI cows) were examined to document the status of national milk quality. All test-day data within herds on any DHI test plan (including owner-sampler recording) were included.
Milk quality experts suggest many factors led to lower SCC in 2017.
Jeffrey Bewley, former dairy professor at the University of Kentucky who is now a support manager with BoviSync, in Fond du Lac, Wisconsin, attributed the SCC improvement to several factors.
They include the continued focus on lowering SCC by milk buyers through incentives and penalties; milk buyers being more strict about accepting milk from high-SCC herds; tighter margins forcing dairy producers to look for opportunities to improve profitability by lowering SCC; the narrowing gap between replacement and cull cow prices, changing economics of keeping high-SCC cows in the herd; and attrition of high-SCC herds.
Gary Neubauer, DVM, senior manager of dairy technical services with Zoetis, said the loss of recombinant bovine somatotropin in some markets meant there was less incentive to keep cows with long days in milk and high SCC in the herd. In addition, newer, larger dairy facilities are improving the environmental conditions for cows, lowering SCC.
Individual state data
These tables include individual state data for herd test days, average number of cows per herd, average daily milk yield and average SCC on test day.
It also breaks out two categories of SCC levels: the percent of days over 750,000 cells per milliliter (the current federal limit for bulk tank SCC for Grade A producers) and the percent of test days over 400,000 cells per milliliter, the current maximum level for milk headed to the EU and some other export markets. (A few states have lower SCC limits compared to federal requirements.)
Click here or on the image above to view it at full size in a new window.
Herd test days higher than the federal limit may overestimate the percentage of herds shipping milk exceeding that limit because milk from cows treated for mastitis is excluded from the bulk tank, even though it is included in DHI test data.
Sixteen states’ average annual SCC was less than the national average, led by Rhode Island and followed by Vermont, Michigan and Nevada. Other major dairy states in the top 10 for average annual SCC were Utah, Wisconsin, Idaho, Oregon, Indiana, New York and Arizona.
In contrast, Oklahoma, South Carolina, Tennessee, Arkansas, Louisiana and Alabama averaged more than 300,000 cells per milliliter, with Alabama’s average above 400,000 cells per milliliter.
State improvement
Eighteen states improved annual average SCC by 10,000 cells per milliliter or more in 2017, led by Kansas, Missouri and South Dakota, which improved 33,000 to 35,000 cells per milliliter. Others with improvements of 20,000 to 28,000 cells per milliliter were Indiana, North Carolina, West Virginia, Wisconsin and Mississippi.
In contrast, average annual SCC rose 10,000 cells per milliliter or more in Montana, Washington, Florida, New Jersey, Tennessee, Alabama and Georgia.
However, Jim Sleper, chief executive officer with Southeast Milk Inc., said his cooperative’s SCC analysis did not correspond with the DHI test-day data, especially as they related to Florida and Georgia. Results from Southeast Milk Inc., which has about 150 members in six states marketing about 26 billion pounds of milk annually, showed small year-to-year improvements.
While not surprised by the drop in the national average SCC, Sleper was surprised by its magnitude (-6,000 cells per milliliter). He attributed some of the decline to herd consolidation as well as increased awareness of EU dairy import requirements.
Herd size improvement
Herds of 3,000 cows or more showed the largest SCC improvement from 2016 (-14,000 cells per milliliter), followed by those herds of 100-149 cows (-7,000 cells per milliliter). The average annual SCC increased 2,000 cells per milliliter in herds of fewer than 50 cows.
Monthly improvement
While the annual average improved 6,000 cells per milliliter, September (-16,000 cells per milliliter) and December (-15,000 cells per milliliter) had the most improvement. April showed the least improvement, with the average SCC down just 1,000 cells per milliliter from the year before. The highest-quality milk, based on SCC, continues to be produced in November and December.
Milk increase correlation
With other factors unknown, there was some correlation in increased milk production per cow related to improved SCC.
Kansas, which had the largest improvement in SCC (-35,000 cells per milliliter) from the year before, was second in milk production increase per cow (3.6 pounds) but remained in the bottom half for annual average SCC (213,000 cells per milliliter) in 2017.
Nevada ranked 11th in improvement (-17,000) and fourth in both average annual SCC (154,000) and milk production increase (3.5 pounds).
Wisconsin ranked seventh in SCC improvement (-23,000 cells per milliliter) and sixth in average annual SCC (180,000 cells per milliliter) but saw a 0.5-pound decline in milk per cow (39th).
Texas ranked 18th in SCC improvement (-10,000 cells per milliliter), 20th in average SCC (199,000 cells per milliliter) and 14th in milk-per-cow increase (1.4 pounds).
The largest milk-per-cow increase was in Louisiana, which ranked second from last in average annual SCC (396,000 cells per milliliter) and in the bottom half for SCC improvement (-2,000 cells per milliliter). ![]()
To see the full report, visit Council on Dairy Cattle Breeding to see the full report.

-
Dave Natzke
- Editor
- Progressive Dairyman
- Email Dave Natzke

