Producer price differentials (PPDs) continue their slow climb out of the historically negative depths of 2020, but their complete ascension may still be a ways off.

Uniform price announcements were released by Federal Milk Marketing Order (FMMO) administrators, April 8-13, covering March milk marketings. As with February milk marketed through FMMOs, uniform or “blend” prices posted small increases from the month before. However, while PPDs improved somewhat, they remained negative in six of the seven orders utilizing multiple component pricing.
Uniform prices and PPDs
March uniform prices at standardized test were higher in all 11 FMMOs, with a high of $20.11 per hundredweight (cwt) in Florida FMMO #6 prices and a low of $14.85 per cwt in California FMMO #51 (Table 1). The February-March price increases ranged from a low of 20 cents per cwt in the Southeast FMMO #7 to a high of $1.04 per cwt in the Southwest FMMO #126.
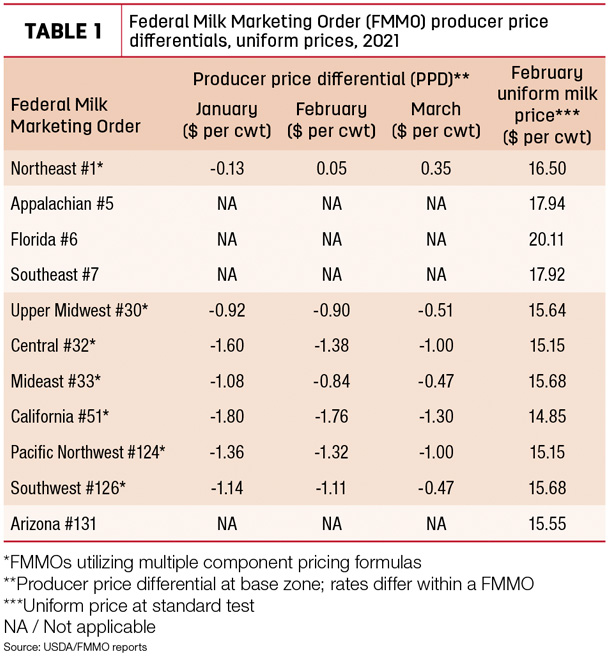
March PPDs improved 30-64 cents from February but remained negative in six of seven applicable FMMOs – although not near as dramatic as those seen during most of the second half of 2020. The Northeast FMMO PPD stayed in positive territory for a second consecutive month at 35 cents.
While some dairy analysts view negative PPDs as simply an accounting tool to balance the value of milk flowing through FMMOs, their depth and duration have affected individual dairy producer’s milk checks. A couple of FMMOs (California and Pacific Northwest) have now seen negative PPDs every month since May 2020, and the PPD has been negative in the California FMMO for 14 consecutive months, since February 2020.
As noted previously, PPDs have zone differentials, so they’ll vary slightly within each FMMO. In addition, PPDs’ impacts on individual milk checks are based on individual milk handlers.
Negative PPDs are one factor in the difference between the monthly “all-milk” price, used as the basis in most risk management programs, and the “mailbox” price, the milk price actually received by dairy producers after marketing costs are deducted.
Webinar ‘demystifies’ PPDs
In an effort to take some of the mystery of PPDs, the Minnesota Milk Producers Association and Wisconsin-based Dairy Business Association cosponsored a webinar, April 13, featuring dairy economist Marin Bozic. He noted negative PPDs are not a new phenomenon, but factors affecting milk marketing last year drove them to new depths for a longer a period. Watch video of Bozic's presentation.
“We've never had a situation before when nine out of 10 consecutive months have negative PPDS [June 2020 through March 2021],” Bozic said.
Bozic outlined six primary factors driving PPDs:
1. Long-term milk class utilization rates, highlighted by declining Class I (fluid) milk sales and increased use of milk in manufactured products
2. Rising milk protein tests and differences in how protein value is collected and distributed
3. The spread in Class III-Class IV milk prices
4. The discrepancy between the advanced fluid price issued before the month starts and the full-month average price
5. The new formula used to calculate the Class I mover
6. Depooling
Those factors maintained their grip in March. The FMMO March 2021 Class III and Class IV milk prices were $16.15 per cwt and $14.18 per cwt, respectively. Although the March Class III-Class IV price gap of $1.97 per cwt was the smallest since May 2020, that canyon remains wide by historical standards. And the March Class III milk price was above the Class I base price for the month at $15.20 per cwt.
Those price relationships created incentives for depooling the higher-valued Class III milk. March levels of Class III milk utilization (Table 2) and pooling inched higher on both a volume and percentage basis, although most remained below pre-coronavirus pandemic levels.
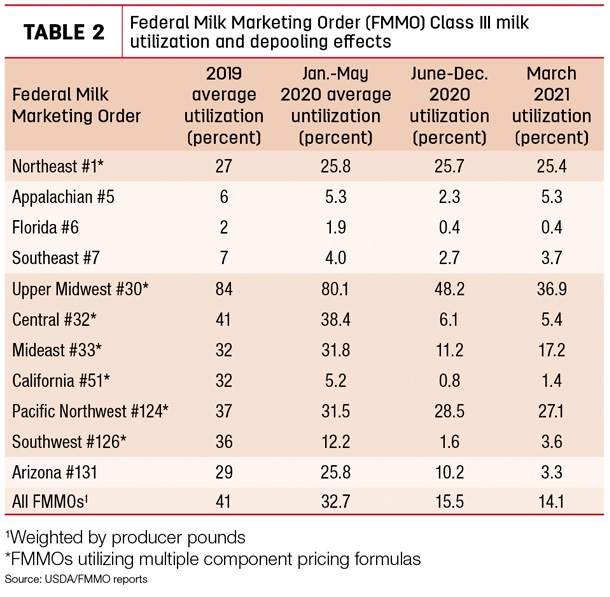
Total Class III milk pooled across all FMMOs in March 2021 was about 1.55 billion pounds, down from 4.21 billion pounds a year earlier. Class III utilization was about 14% in March 2021, under the 31% pre-COVID-19 total for March 2020 and far below the average of about 41% for all of 2019.
Looking back, ahead
Using the six factors listed above – separately and collectively – over a 10-year period to determine baseline PPDs, Bozic calculated the impact on applicable FMMOs. Based on his analysis, individual FMMOs were affected differently by each factor. However, the Class III-Class IV milk price spread and depooling, often linked to that spread, were the two biggest factors impacting PPDs.
Bozic and Cornell University dairy economist Christopher Wolf recently published two papers related to negative PPDs. Read: Analysis of Producer Price Differentials for March 2021 and Negative Producer Price Differentials in Federal Milk Marketing Orders: Explanations, Implications and Policy Options.
Near term, the FMMO Class III-Class IV price gap averaged $2.27 per cwt in the first quarter of 2021. As a simple predictor of PPDs and FMMO pooling behavior, Chicago Mercantile Exchange (CME) futures prices indicate the gap between Class III-Class IV milk prices expands slightly in the second quarter of 2021 but then tightens somewhat into the first half of 2022.
As of the close of CME trading on April 13, the Class III-Class IV price gap grows to $2.87 per cwt in the second quarter, closes to $1.99 per cwt in the third quarter and tightens further to 90 cents per cwt in the fourth quarter of the year. That would yield a Class III-Class IV milk price gap of $2.01 per cwt for the year, still above historical averages, but far less volatile than last year. The 2020 Class III-Class IV price gap averaged $4.68 per cwt in 2020 and averaged more than $8 per cwt between June-November.