November 2017 U.S. milk production grew just 1 percent compared to the same month a year earlier, with weak growth in milk output per cow applying most of the brakes. Nationally, cow numbers remained at a six-month low.

USDA: November recap
Reviewing the USDA estimates for November 2017 compared to November 2016:
• U.S. milk production: 17.28 billion pounds, up 1 percent
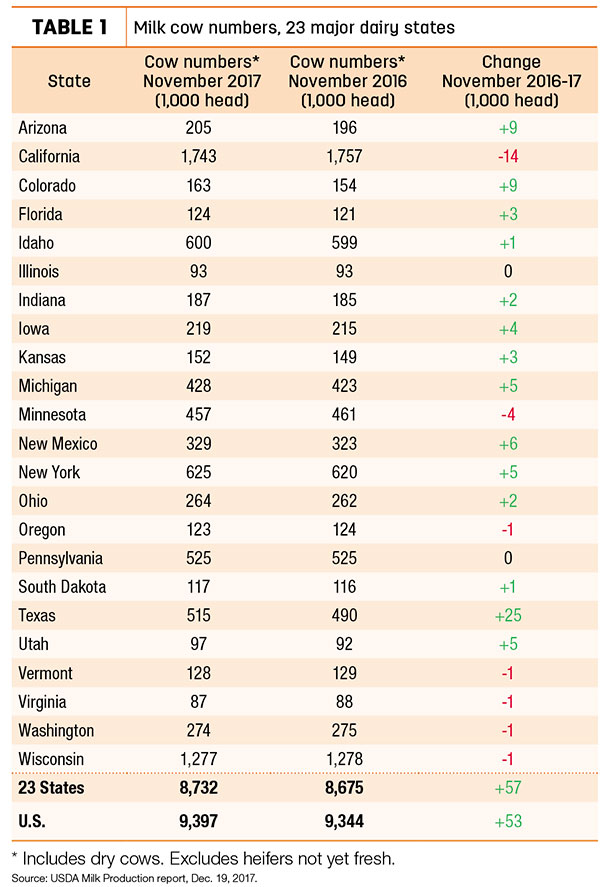
• U.S. cow numbers: 9.397 million, up 53,000 head
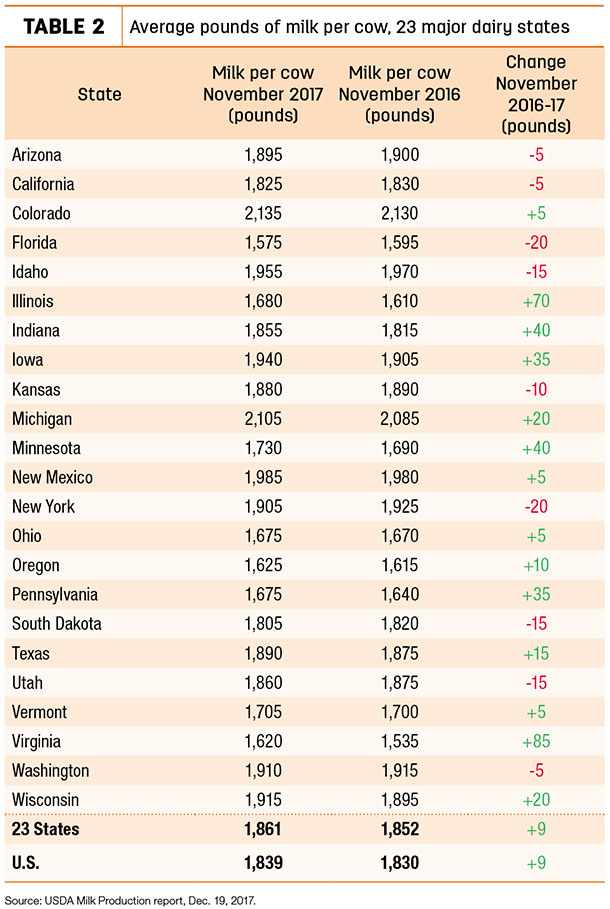
• U.S. average milk per cow per month: 1,839 pounds, up 9 pounds
• 23-state milk production: 16.25 billion pounds, up 1.1 percent
• 23-state cow numbers: 8.732 million, up 57,000 head
• 23-state average milk per cow per month: 1,861 pounds, up 9 pounds
Cow numbers
Nationally, November milk cow numbers were unchanged from October, but 57,000 head more than November 2016 (Table 1).
Compared to a year earlier, largest growth was in Texas (+25,000 head), Arizona and Colorado (each +9,000 head) and New Mexico (+6,000 head). California (-14,000 head) and Minnesota (-4,000 head) led decliners.
Milk per cow
Changes in monthly milk output per cow followed previous trends, with output lower than year-ago levels in most Western states, including Arizona, California, Idaho, Kansas, Utah and Washington, along with Florida, New York and South Dakota. In contrast, milk output per cow rose 2 pounds per day in Illinois and Virginia, and more than 1 pound per day in Indiana, Iowa, Minnesota and Pennsylvania (Table 2).
Milk production
On a percentage basis, November milk production was up 6.1 percent in Colorado, 5.9 percent in Texas and at least 4 percent in Arizona, Illinois, Utah and Virginia.
Among the other largest states, Pennsylvania output was up 2.1 percent, while Wisconsin production was up just 0.9 percent. Production in California (-1.1 percent), Idaho (-0.6 percent) and New York (-0.3 percent) were all lower.
USDA outlook
The USDA’s latest Livestock, Dairy and Poultry Outlook report forecasts continued milk production growth ahead, with cow numbers projected to rise through 2018. 2017 milk production is now forecast to be up 1.6 percent from 2016; 2018 production will rise 1.7 percent.
Despite the modest growth in milk production, prices are expected to be weaker. USDA projections put the 2017 all-milk price at $17.65 per hundredweight (cwt), falling to about $17.05 per cwt in 2018. The USDA-projected 2017 Class III price is about $16.20 per cwt, dipping to $15.70 per cwt in 2018. The projected 2017 Class IV price is $15.15 per cwt, weakening to $14.35 per cwt in 2018.
Cropp-Stephenson outlook
Mark Stephenson, director of dairy policy analysis at the University of Wisconsin – Madison, and Bob Cropp, dairy economics professor emeritus, summarized the dairy situation in their monthly podcast.
The 1 percent increase in monthly milk production is slower, but it is on top of strong gains in the final quarter of 2016. Current and futures milk prices don’t make it feel much like Christmas, they noted.
Things have eroded quite a bit in recent months. 2017 will provide some price improvement over 2016, but the outlook for 2018 does not offer much optimism. Stephenson said individual dairy farm financial pictures are becoming more desperate, with low to negative profitability in 2017. Moving into 2018, liquidity challenges will increase.
There is potentially good news on the consumer side, with a strong U.S. stock market and consumer confidence. Domestic sales are “fairly good,” and cheese exports are providing some support. The big problem, however, remains increased milk production among all major dairy exporters, as well as burdensome milk powder stocks globally.
In his monthly Dairy Situation & Outlook report, Cropp said the Class III price was $16.88 per cwt in November, the high for the year, but will fall to near $15.45 per cwt in December. This will make the average for the year about $16.20 per cwt, compared to $14.87 per cwt last year.
The November Class IV price was $13.99 per cwt and will fall to near $13.60 per cwt in December. The average for the year will be about $15.15 per cwt, compared to $13.77 per cwt last year. So while milk prices were not the greatest, 2017 was still an improvement over 2016.
While he doesn’t rule out better milk prices in the second half of 2018, Cropp projects Class III prices in the $14s for the first half of the year, with Class IV prices in the $13s. Current Class III futures are even lower for February and March.
If prices recover later in the year, Cropp said the 2018 Class III price could average about $1 lower than 2017, at $15.20 per cwt. The Class IV price would average about 85 cents lower than 2017, at $14.30 per cwt.
Margins start December weaker
Dairy margins ended November mixed, but deteriorated over the first half of December, as lower milk prices more than offset the impact of cheaper feed costs, according to Commodity & Ingredient Hedging LLC. Margins are now negative through the first half of 2018 and only projected slightly above breakeven through the second half of the year.
Milk prices continue to be pressured by the large global overhang of dairy product stocks, particularly nonfat dry milk (NDM) and skim milk powder (SMP). The European Union (EU) is sitting on 365,000 metric tons of SMP, the equivalent of about one-third of U.S. annual NDM/SMP production. The European Commission rejected all SMP purchase offers as too low at their most recent tender, Dec. 12, and has proposed removing the fixed purchase price requirement when Intervention reopens in March to limit or prevent a further buildup in stocks.
Meanwhile, the USDA reduced their projected 2018 all-milk, Class III and Class IV prices, despite lower projected milk production. Growing dairy product stocks and a more bearish outlook for cheddar cheese, butter, NDM and dry whey were cited for the weaker prices.
Also impacting the U.S., the EU and Japan reached a trade agreement that will lower tariffs on some farm products, including cheese, effective March of 2019.
On a positive note, feed costs decreased slightly, with corn moving to fresh contract lows, despite the most recent USDA World Ag Supply and Demand Estimates report that cut ending stocks 50 million bushels due to higher projected ethanol usage. ![]()

-
Dave Natzke
- Editor
- Progressive Dairyman
- Email Dave Natzke


