With the high level of volatility in milk prices in recent years and even recent months, many people look to other economic indicators and indexes to see if a pattern exists. In order to get an idea of any correlations, I tracked milk prices with the consumer confidence index, crude oil price, gross domestic product and disposable personal income.
First, I used the Class III milk price because it is relatable to most of the country and highly correlated to milk prices throughout the country, including California.
When doing the background research for comparing prices, I found very little difference in results using the Class III price compared to other milk and dairy product prices across the country. If you are uncomfortable with the Class III milk price, you can exchange Class III with most of the other class prices and have very similar results.
Figure 1 shows the Class III milk price versus crude oil prices since 2004. Given energy costs’ association with high feed prices and subsequently high milk prices in the past, I thought it would be good to break down the actual price comparison and correlation.
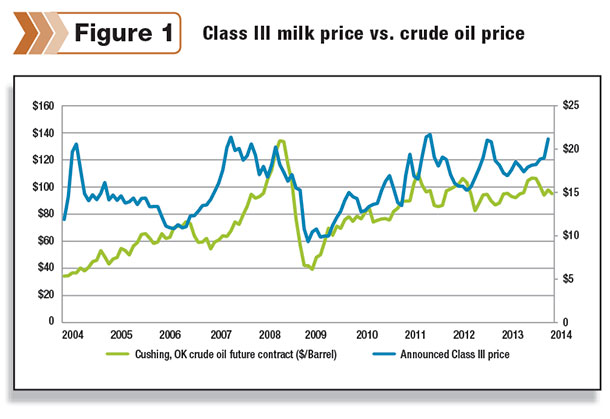
From 2004-2007, the Class III milk and crude oil prices moved against each other rather than together. As crude oil bottomed out in 2006, the Class III milk price peaked. Then moving into 2007, 2008, 2009 and even 2010, prices started tracking much closer together.
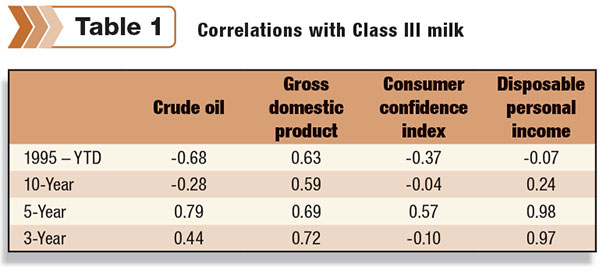
While things seemed like they were highly correlated, the actual correlation was only 0.57 for 2008-2010. Although that is not something to ignore, it is far from the scientific definition of “highly correlated” which is 0.8 or greater.
Moving on from 2010, the trend for both crude oil and Class III milk move in the same direction, but the correlation isn’t very high. Over the past three years, the crude oil and Class III milk price correlation is only 0.44.
Figure 2 depicts the Class III milk price versus the gross domestic product (GDP) since 2004. While the figure is a little more choppy (partially because GDP data is available only on an annual basis), the pattern isn’t too dissimilar from the crude oil versus Class III figure.
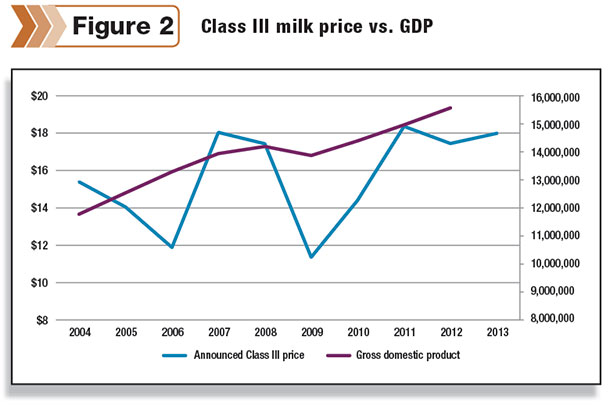
Prices diverge in 2006, both decline in 2009, and then the trend is moving higher since 2009. The correlation between Class III milk and GDP isn’t insignificant. It even reached 0.72 for the past three years, but it also isn’t technically high for any period of time.
Figure 3 shows the Class III milk price versus the consumer confidence index since 2004. Again, this figure has many similarities to the previous two figures. Nothing appears to be correlated prior to 2008, there is a significant drop for both data sets in 2009, and then both trend higher through present day.
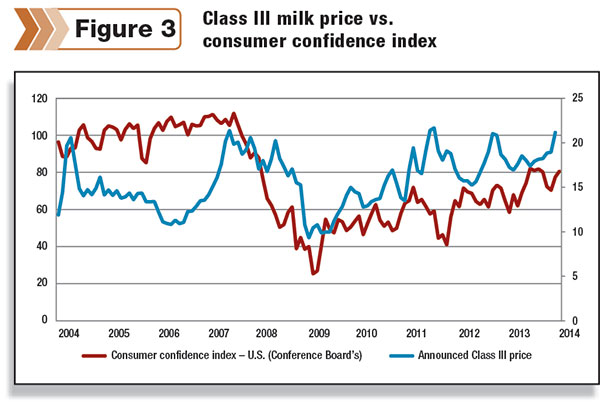
Like the Class III milk price, the consumer confidence index has a lot of short-term volatility. But unfortunately the volatility in Class III and the consumer confidence index do not match up since 2010.
You can see that several times the milk price rose while the consumer confidence index declined, and unfortunately, there is no inverse relationship either. Looking at the chart of correlations between Class III and the consumer confidence index, we see most of the time frames have very low correlations.
Last, Figure 4 shows Class III milk versus disposable personal income. Once again, through 2006 the two data sets don’t have a high correlation; in 2009 both decline drastically, and then after 2009 both see an increase, with disposable personal income declining in recent years while Class III moved slightly higher.
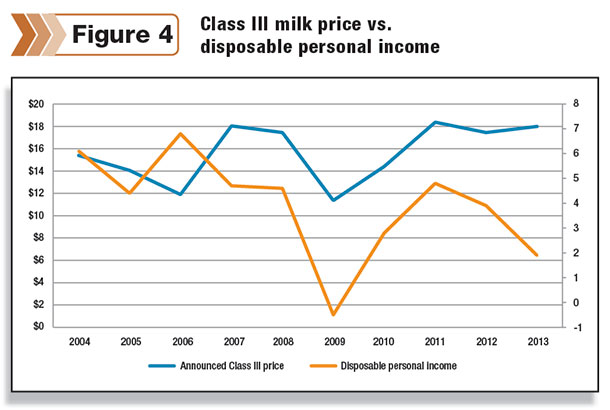
Although there are many divergences in this last figure, the correlations between Class III milk price and disposable personal income are high in recent years. This is an easy concept for us as consumers and us in the dairy industry to understand.
When finances are tight, we conserve more and a common expense to cut is food and dining. If a family eats home and has macaroni and cheese out of the box, with a protein and vegetable, they are typically consuming less dairy than when they dine out, where they may have bread with butter, pasta with fresh cheese and a protein and vegetable that are most often cooked in butter.
When looking at the figures, it is interesting but not surprising to see 2009 stick out like a sore thumb. There was a global economic crisis at that time, and therefore most economic indicators declined during that time frame along with most commodity prices.
I don’t think using any of this data will be helpful to predict the future of the milk price, but I do think understanding the milk price volatility is important while we always go back to the basics of supply and demand and are historically familiar with milk production versus milk price (milk production goes up too high, and milk prices typically decline).
This data is just another reminder of our presence in the world market, and a likely assumption is that when the world economy struggles, the U.S. economy struggles and dairy prices will struggle. Some indictors to watch to get a better understanding of the future milk price are the following:
 • Milk production – This will always be a key player; if milk production moves drastically higher or lower, it will have an impact on milk price. More than the actual milk production number, look to see what will impact milk production. Examples include high or low milk prices, severe weather in a high milk production area, feed issues, etc.
• Dairy exports – This has been a key indicator in recent years, and I think it will continue to make a significant impact on the domestic price. The problem with looking ahead to our international consumers is that understanding the international [scene] is very difficult. China will continue to be large consumer, but their economic strength is often difficult to accurately understand and can change with little notice.
• World weather – This is a factor that is a little easier to gauge than the world economy; however, we can only project the short-term weather. As we have seen in recent years, the weather in Oceania can strongly impact our export opportunities.
To me the greatest take-home from this data is that the milk price is fragile, and although the dairy industry can work hard to keep the supply/demand ratio in check, the world may throw different situations at us that we cannot control or combat as an industry.
However there are a growing number of risk management strategies available to you as a producer to help you independently protect your business including the government’s new margin insurance program that will be highly discussed in the upcoming months.
As always, I recommend taking some time to educate yourself on the risk management strategies available to you to best protect your milk price and your business. PD
Katie Krupa is a broker with Chicago-based Rice Dairy, a boutique brokerage firm offering guidance, analysis, and execution services on futures, options, spot and forward markets. You can reach Katie by email or by phone (570) 468-6739. Visit the Rice Dairy website . There is risk of loss trading commodity futures and options. Past results are not indicative of future results.

Katie Krupa
Broker
Rice Dairy


