The Northeast Dairy Farm Summary (DFS), a joint report by Farm Credit East and Yankee Farm Credit, reports that profitability climbed for the Northeast dairy industry with an increase of $75 in average net earnings per cow. Average net earnings were $490 per cow, bringing the three-year average to $567. The DFS includes financial data from 517 farms in New England, New York and New Jersey.

Income was up as the milk price rose by $1.56 per hundredweight (cwt) to an average of $21.30. Cost of production increased as well by $1 per cwt to $19.23, preventing producers from realizing the full gain from the higher milk price.
Significant increases were seen in feed costs (up 5 percent), labor (up 2 percent) and crop inputs (up 8 percent per cow). Feed, a typical dairy farm’s most significant expense, remained quite expensive through most of the year as the 2012 drought-stricken crops worked their way through the system. Some relief was felt at the very end of the year as the more abundant 2013 crops became available.
In terms of actual (not adjusted for inflation) dollars, 2013 was the fourth-most profitable year in the history of the DFS, after 2007, 2011 and 2004.
Productivity measures were mixed. Per-cow production was up by 1.3 percent from 2012 at 23,848 pounds. Milk sold per worker was down 1.7 percent to 1,097,288 pounds per year.
Cash flow was more than sufficient to meet all financial commitments (e.g., operating expenses, debt repayments, family living and income taxes), to cover some capital purchases and, for some farms, to pay down debt. Nonetheless, average debt-per-cow increased 8 percent to $3,384.
Driving this increase were capital expenditures that exceeded earnings. This has been an oft-repeated practice in recent years; the five-year average shows earnings of $342 per cow and capital expenditures of $654 per cow.
Over the most recent three years, earnings have averaged $567 per cow and capital expenditures $782. Capital expenditures must enhance the overall long-term goals of the business and, with the exception of land purchases, should typically demonstrate payback periods of less than four years.
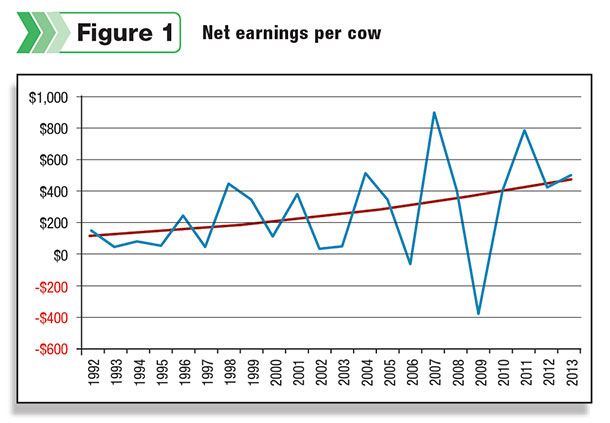
Volatility in earnings eased somewhat, as 2013 was modestly more profitable than 2012. Both years were significantly less profitable than 2011, as can be seen in Figure 1 .
The average farm milk price, at $21.30 per cwt, was up nearly 8 percent from 2012’s $19.74. It was $2.49 above the five-year average of $18.81 per cwt. In terms of actual milk prices, 2013 ranked third-highest in the 32 years of the DFS.
In terms of inflation-adjusted rankings, 2013 drops to 14th. The first year of the DFS, 1979, ranks first. In thinking about the three-year price cycles the industry has been experiencing, 2013 was the “average” year of the most recent cycle. 2014 will be a “high” year, and from there we will have to wait for history to write itself.
The net cost of production (NCOP) increased by 5.5 percent from 2012 to a new high. 2012’s NCOP was $18.23 per cwt. 2013’s NCOP rose to $19.23, the highest in DFS history. Three key figures to review for 2013’s cost of production analysis of the average dairy farm in the DFS include:
- Cash operating expenses were $20.63 per cwt, up slightly from 2012.
- Total costs, including depreciation and family living, were $22.82 per cwt, up $0.35.
- After subtracting non-milk income, NCOP was $19.23 per cwt, up $1 per cwt from the previous year. In other words, despite strong beef prices contributing to non-milk income, the overall poor crop year in our region caused feed inventories to decrease enough that net cost of production increased more significantly than the total costs.
The DFS breaks down financial data by herd size, profit groups and region. It was noted that larger herds tend to have an advantage in NCOP and profitability, although that tendency is not a guarantee as several large herds had below-average profitability, and all size herds were represented in the DFS’s top-profit quartile.
As a group, the largest herd-size category (700 cows or more) was by far the most profitable of the four size groups in the DFS, with $664 in net earnings per cow. In addition, this group was:
- The most productive on milk-sold-per-cow and per-worker measures
- Had the lowest per-cow investment in productive assets, meaning it utilized capital investment more efficiently
- The lowest-cost producer
We saw a wide range of profits around the $490-per-cow average in 2013. Some farms lost more than $1,000 per cow while others posted more than a $2,000 gain. Table 1 demonstrates the range of profitability between the top-profit and bottom-profit groups. Farms in the summary are ranked by profit margin and divided into four quartiles. For the sake of comparison, the all-farm average is also included.
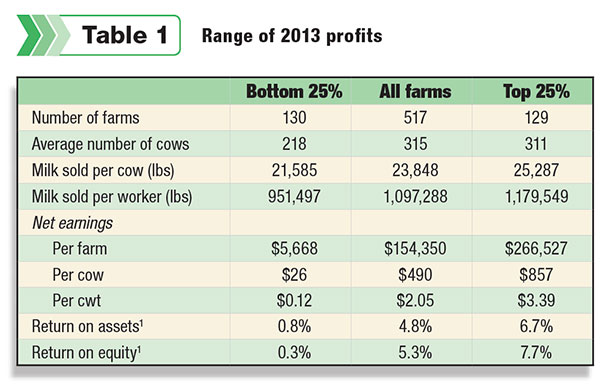
There was an $831 difference in net earnings per cow between the top-quartile and bottom-quartile groups. This is smaller than last year’s difference, which stood at $1,257. Similarly, on a per-cwt basis, the top farms posted $3.27 more net earnings than the least profitable farms with earnings of $3.39, while the bottom group earned only $0.12 per cwt.
Several management factors contribute to this disparity. Also shown in Table 1 are two productivity measures. The top 25 percent group sells 17 percent more milk per cow and 24 percent more milk per worker than the bottom 25 percent, which contributes to the bottom line.
A deeper look at dairy earnings volatility
In recent years, dairy earnings have fluctuated significantly – and 2013 results show no differently. But is this trend of volatility in net earnings really new?
There are many ways to statistically analyze numbers. Two commonly used metrics are mean and standard deviation. The mean is simply the average of a group of numbers. The standard deviation is a measure of the amount of variation in that group.
The coefficient of variation is the standard deviation divided by the mean – in other words, a measure of the relative variation of the data in proportion to the mean. It’s a way to compare relative variation when the means of two data sets differ.
Note the black trend line in Figure 1 representing a continual increase in per-cow net earnings (profitability) over time.
If we look at the past 10 years, compared with the 10 years prior, mean net earnings and standard deviation have both more than doubled in absolute terms. However, in relative terms, the coefficient of variation was 85 percent in the 1990s and 102 percent in the 2000s.
That’s the percent of variation relative to the mean. In other words, earnings swings have been greater but so has average net earnings. Taking out a single year (2009) drops the coefficient of variation to 66 percent. This implies a few things:
- Compared to the mean of net earnings, the industry has actually not been much more volatile in a proportional sense over the last decade than it was in the prior decade.
- But since the mean is more than double that of prior years, that volatility is more extreme in an absolute sense.
- Is this the “price of admission” – substantially stronger earning potential in recent years but also large swings in year-to-year earnings?
- There is much discussion as to whether the dramatic earnings swings of the past 10 years are an anomaly. This analysis suggests that these earnings swings are neither a new nor an unusual phenomenon but rather a proportional extension of the preceding decade.
- The past 20 years indicates that we can expect to continue to see similar volatility in future years, with a standard deviation close to the mean, or average, of net earnings. A 2009-like scenario seems unlikely, barring another global recession or black swan event, but a market correction is likely to occur, and swings in earnings should be expected to continue at similar levels.
The point is not to make light of the past decade’s earning swings, nor to say that downturns aren’t painful. Rather it is to suggest that the volatility we’ve seen in recent years is consistent with prior years, and that it is likely to continue as mean net earnings increase overall.
Although the DFS is primarily a rearward-looking summary of actual dairy farm results, it does offer some lessons or suggestions for the future: It suggests that volatility in milk prices and earnings are likely to continue, as variation in earnings has increased with average net earnings over time. 2014 is continuing that trend with record industry earnings, and 2015 is likely to show a reduction in earnings.
The DFS also showed that farms with “efficient high production” tend to outperform the industry average. Some top-producing herds were not the most profitable, as expenses can creep up with increased production, due to the law of diminishing returns. But farms that managed to find the “sweet spot” between controlling costs and achieving high production are some of the most profitable in the summary.
In addition to the DFS, we also offer dairy producers a much more intensive benchmarking service that combines additional expense detail with a wide variety of management information to provide the basis for a consultative relationship with their dairy consultants.
More than 160 progressive, larger, above-average farms participate in this fee service and find they enhance their profitability and business acumen significantly, quickly paying back their initial program investment. The service includes management reports, networking meetings, customized industry-related content and other information. PD
For more information contact Bill Zweigbaum directly by email or call (518) 281-3867. The complete Northeast Dairy Farm Summary is available online. (PDF, 829KB)
Chris Laughton and Joanna Lidback are also with Farm Credit East.

Bill Zweigbaum
Consultant
Dairy Benchmark Program
Farm Credit East


