World The globe was awash in milk in 2015 as the EU removed its milk quota production restrictions and major dairy buyers remained on the sidelines. As a result of oversupply and low international prices, U.S. milk had a harder time moving into global markets.

For the first time since 2009, the value of U.S. dairy products traded overseas declined 26 percent year-over-year while volume of products traded was down 8 percent, according to USDEC.
The total percentage of U.S. milk leaving as exports fell to 14 percent, the lowest annual percentage exported since 2012.
Nation
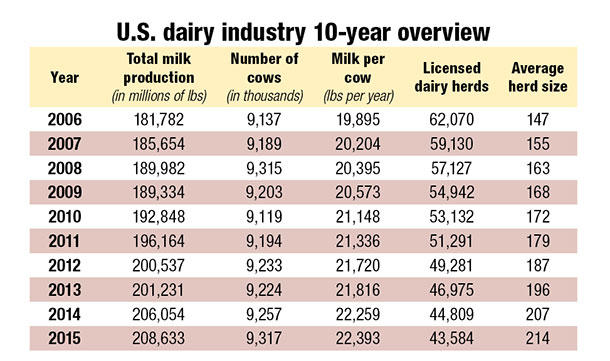
The number of milk cows in production in the U.S. was the highest in 2015 since the last peak in 2008. It’s taken more than six years for cattle numbers to return to levels unseen since the 2009 economic milk price collapse. At the same time, dairymen are bracing for a prolonged milk price downturn in 2016.
Last year U.S. herds added 60,000 cows to their ranks, as the total number of milk cows exceeded 9,317,000 cows. In 2008, the U.S. milking herd was 9,315,000 cows.
Per-cow production was up .6 percent, and total milk production was 208.6 billion pounds, up 1.3 percent from 2014, the second-smallest year-over-year increase since 2009. More than 1,200 operations exited the industry. The exit rate (2.7 percent) was below the five-year average of 3.9 percent.
Region
As is typical following a boom price year like 2014, Midwest milk production expanded while production in the West moderated, or declined in some states. Midwest milk cow numbers were up 47,000 and per-cow production was up 3 percent. More than 70 percent of new milk production in 2015 came from the Midwest.
Milk cow numbers in the Southwest were largely unchanged, but the region saw a 2.5 percent decline in total production in 2015 due to per-cow production declining by the same percentage. The Southwest was the only region that experienced a per-cow production decline in 2015.
States
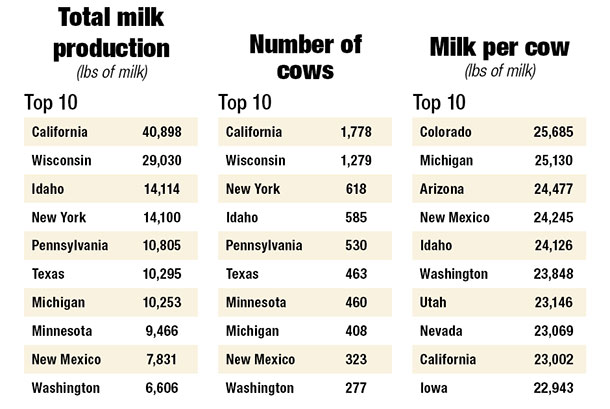
There were no changes in the order of the Top 10 milk-producing states. On average, these 10 states grew .8 percent in total milk production in 2015. Notable among the Top 10 states were the declines in total production in California (-3.4 percent) and New Mexico (-3.4 percent) and an increase in production in Michigan (6.7 percent).
Michigan added the most cows of any state in the nation last year (+18,000). The state closed within striking distance of overtaking No. 6 Texas. The gap between the two states at the end of the year was the difference between the average annual production of just one Michigan herd of 1,671 cows.
Iowa overtook Arizona to become the No. 12 milk-producing state in the country. The Hawkeye State had a 4.2 percent increase in total milk production last year.
Florida moved up to the No. 18 spot. It was one of only five states, according to the USDA, to post positive increases in both total milk, per-cow production and milking cow population and at the same time not lose any licensed herds. Other states who completed the same feat were Arizona, Colorado, South Dakota and Utah. PD

-
Walt Cooley
- Editor-in-chief
- Progressive Dairyman
- Email Walt Cooley

