In 1950, the dairy industry was pretty simple. Milk was produced primarily for drinking with some used for butter churning and some for ice cream. Dairy processors were within 100 miles of their suppliers and customers. Milk that was pasteurized for drinking was only available as whole (full fat) milk. Good ice cream had high butterfat content. Producers were paid for the volume of milk they produced and maybe the butterfat content.

Today, the industry is very different. Milk for drinking is a small category, and the most popular type of milk sold is 2 percent reduced fat. Most milk is used for cheese manufacturing. The products with a growing market are cheese and yogurt. The export market is growing fast and needs products with minimal water and a long shelf life.
The majority of producers today are paid on components: milk protein, milk fat and other solids. Since the introduction of the current Federal Milk Marketing Order pricing system in 2000, two of the components have seen significant price increases.
Today, milk protein is worth more than twice as much as it was in 2000. “Other solids,” which for the first seven years of the current system were nearly worthless, are now contributing nicely to the producer paycheck. Milk fat has increased only slightly in value.
Figure 1 shows the trends in component pricing. If the unusual gyrations of 2008-2009 were removed, a clean pattern of sustained growth would be seen in the price of protein.
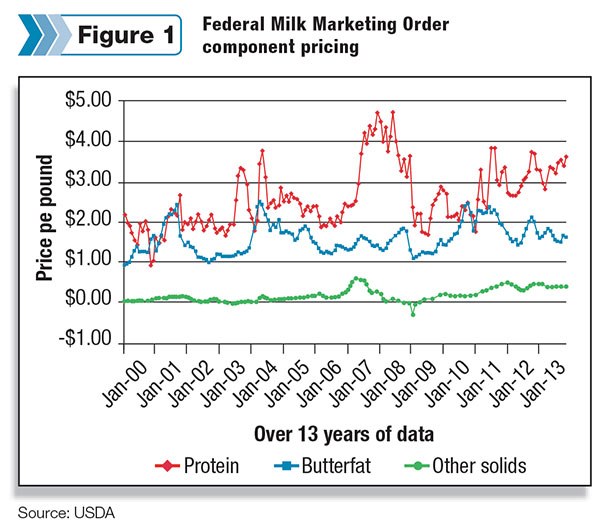
Currently, payment for milk protein makes up 56 percent of the Class III price. Milk fat has decreased to 33 percent, and “other solids” have increased to 11 percent, according to the USDA.
Will these trends continue? Will protein continue to increase in value? Will other solids pricing continue to be a financial contributor? Will milk fat remain under $2 per pound, or will it increase?
This article will examine the underlining factors that will influence the value of these components and where the prices of these components will likely go. The first to be examined will be milk protein, the leader in today’s pricing.
Will milk protein continue to increase in price?
Milk protein presents a very optimistic picture. The domestic growth markets require milk protein and so do the export markets. The domestic growth markets include cheese and yogurt, and they both require high levels of protein. The export market requires dairy products with high solids content and high protein content.
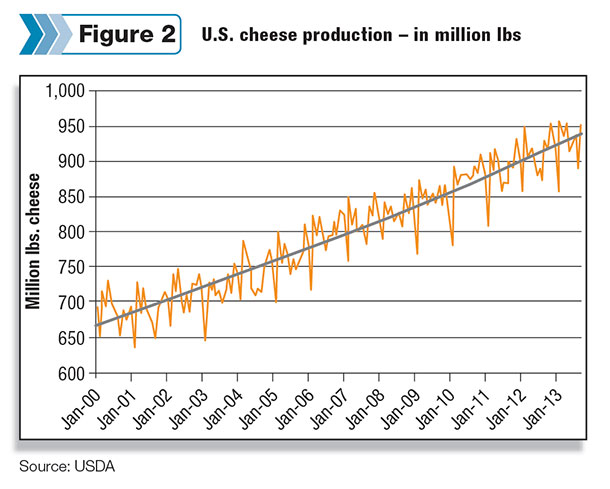
Cheese manufacturing in the U.S. has a long history of growth. Most cheese (94 percent) is consumed domestically and the growth in per-capita consumption has been long and steady. Some countries like France eat nearly twice as much cheese as the U.S. currently does, so these trends can continue for some time before reaching market saturation.
To efficiently manufacture cheese, there has to be enough protein to meet the standards first developed by Dr. Lucius L. Van Slyke in the early 1900s. Casein protein, which makes up approximately 80 percent of the protein in cows’ milk, must be available to trap the milk fat.
Protein levels are typically the limiting factor for cheese production and often, additional protein (from sources like nonfat milk or protein concentrates) must be added to the milk to make the ratios right for making cheese. Stated simply, with more cheese being produced, more protein is needed.
The recent growth of yogurt has been spectacular. Compared with cheese, yogurt is a much smaller category, but it is experiencing rapid growth. It is currently growing around 6 percent annually compared to cheese at a 2 percent annual growth rate.
Protein is very important in yogurt because much of the production is fat-free or reduced fat. Thicker yogurts, which are increasingly popular, depend partially on the coagulation of milk protein. The addition of milk protein concentrates to help in the thickening process is common. Clearly, milk protein is very important for yogurt manufacturing.
The U.S. per-capita consumption of yogurt is less than one-third of Sweden’s per-capita consumption, so the growth will also not reach saturation levels for a very long time.
As illustrated in Table 1 , the export markets are very much oriented toward protein. Currently, about 16 percent of U.S. milk components are exported.
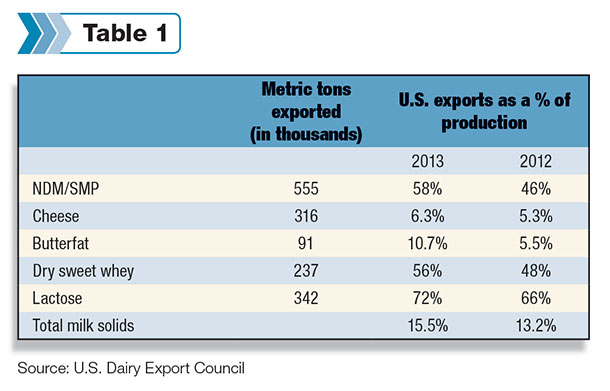
Powdered milk is the largest dairy category exported. Within the powdered milk category, the U.S. produces very little whole-fat milk. It is much easier to ship and store nonfat dry milk because there is no fat, which would require refrigeration or other protective means for stability.
Currently, more than half of the nonfat dried milk produced is exported, and those exports grew by 20 percent in 2013. The U.S. production of nonfat dried milk uses nearly half of the amount of milk consumed for domestic fluid milk consumption. The category is growing, based primarily on exports, while domestic consumption of drinking milk is shrinking.
Will milk fat remain under $2 per pound?
The price of milk fat is based on the demand and supply from domestic consumption and exports. The picture is not good.
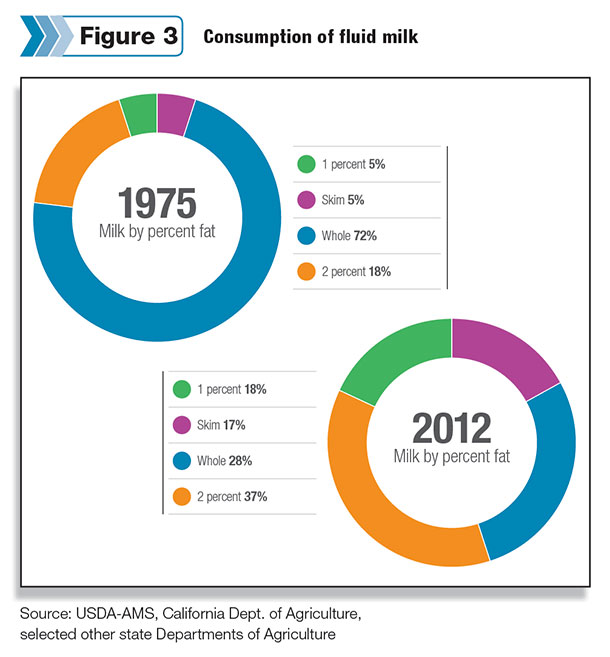
Consumption of drinking milk has consistently declined, and there is no rational reason to think this will not continue. Additionally, what is consumed is lower-fat milk. In 1975, 72 percent of milk consumed was whole milk. Today, only 28 percent is whole milk, and the leading category is 2 percent fat milk with a 37 percent share.
Additionally, in the last three years, 2 percent milk has lost three percentage category points to 1 percent fat milk. If this continues, in nearly a decade, 1 percent fat will be the market leader.
Cheese is the growth category for dairy products. Nature’s milk is typically just a little shy of the level of protein needed for efficient cheesemaking. Milk fat is never in short supply for making cheese.
Low-fat cheeses are a small category currently, but they are growing and could reduce the amount of milk fat needed for cheese.
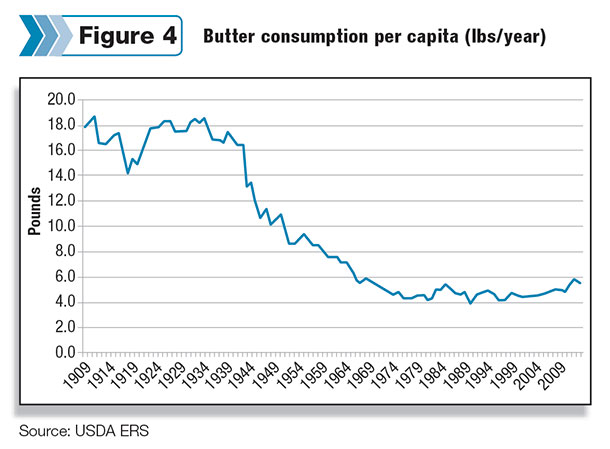
Butter per-capita consumption dropped significantly after the development of vegetable spreads. After falling significantly, it has remained relatively constant for nearly 40 years. There are many competing spreads with lots of good marketing and low prices. The future can probably be best characterized as flat.
Most of the export business relies on products with protein. The only exception is butter. Just over 10 percent of U.S. butter is currently exported, and those exports are up over prior years. It is too early to call this a trend, but it is a welcome market for milk fat with great potential.
Will “other solids” retain their “new normal”?
The price of “other solids” is derived from the price of dry whey. The federal order formula for “other solids” is the price of dry whey minus the cost to process it (primarily drying) times a yield factor, which is primarily based on the typical water content of dry whey.
Other Solids = (Dry Whey Price-$0.1991) x 1.03
In the past, the dry whey price has been equal or lower than the cost to process it, which has on occasion made the value of “other solids” negative. Today, with high export volumes and more uses for whey, the prices of dry whey have gone well above the processing cost and given “other solids” a value around $0.40 per pound.
“Other solids” are contributing a little over $2 per cwt to the Class III price of milk. Because the weight of “other solids” is twice that of milk protein, price changes can dramatically influence the Class III price, which limits the supply.
Whey is unique. No one manufactures whey. Whey is strictly a byproduct of cheese manufacturing. If the demand is greater than the supply, there is no way to increase the supply of whey alone. Whey from yogurt manufacturing is acid whey, not sweet whey, and to date there are few uses for acid whey. Dry sweet whey comes from cheesemaking alone.
The majority of dry whey is exported, so the international market for whey and international competition will also influence the price.
With all these factors playing into the price of dry whey, it is very difficult to predict the future. However, if current conditions persist and there are no major international upsets, current pricing should be maintained. It is even possible to think of higher prices for dry whey and “other solids,” but because of the huge international influence, this is very difficult to predict.
New product directions
In December 2013, a global webinar with sponsorship by Fonterra, Arla, Atlantia, Nizo and Roquette was held to discuss new dairy research, new dairy products and new formulation techniques for dairy products. In addition to the sponsors, many major dairy companies made presentations.
There were many new “high-protein” products and protein additives; there were presentations on new formulation techniques to retain cheese flavor and mouth feel with lower fat (and salt). There was not a single new product or formulation that was aimed at higher-fat products.
Conclusions
The current U.S. domestic growth products are cheese and yogurt, which require high levels of milk protein. The trends in milk consumption are favoring lower-fat milk. The growth in export products is primarily fat-free. A review of upcoming new products for the dairy industry shows favor for higher protein and lower fat.
In conclusion, milk protein is hot and milk fat is not. Demand for milk protein will be high and demand for milk fat will not be high. This will drive milk protein prices higher and milk fat prices lower.
Through feed formulation, genetics and other techniques, cows can produce more protein, but typically there is more fat produced as well and the ratio of milk protein to milk fat does not change that much.
The emphasis on dairy products with protein will drive the need for milk, and along with this, there will be more fat produced which must find a home. That will probably drive milk fat prices down, or at best, hold them at current levels. The future of milk protein pricing looks very positive.
“Other solids” will likely maintain their pricing or perhaps gain a little, but the international market factors could make this pricing volatile. PD


