Lameness can be the most costly disease on dairies, even more so than mastitis. This is due to the high incidence of lameness on dairies. It is not uncommon to find 30 percent yearly incidence or higher on dairies, yet lameness is one of the least entered and tracked diseases.
Lameness effects production, reproduction and how long the animals will be in the herd. Lameness is often neglected because early symptoms are subtle and the cow’s natural instinct is to hide her discomfort. This causes failure of early recognition and timely treatment. DC305 has developed a system for recording and analyzing lame events and foot trims. It standardizes “LAME” protocols and entry, and works cleanly with Pocket Trimmer. This is the Lameness Manager.
Using the Lameness Manager allows dairies to have a way to easily set up trim lists, recheck animals, add animals observed lame and be sure no animals are missed. It then allows for quick and easy data entry of trim/lame results with the use of protocols. Once this has been achieved, you can analyze the data showing lameness incidence, how many animals are being trimmed, if protocols are being followed and most importantly, help you discover why animals are becoming lame. You can look at the type of lesions and incidence by pen or lactation group, helping you narrow down possible causes of lameness.
One of the graphs that you will find in GUIDE in DC305 is one to see if you are trimming enough animals. To figure out the number of animals that should be trimmed, use this simple calculation and then see if what is being trimmed on the graph is enough:
[Total herd size X (number of trimmings each lactation + lameness risk + replacement rate)]/12 months
An example for a 3,000-cow herd with two trims per lactation would be:
[3,000 X (2 + .3 + .3)]/12 = 650
Click on the images below to view them in more detail.
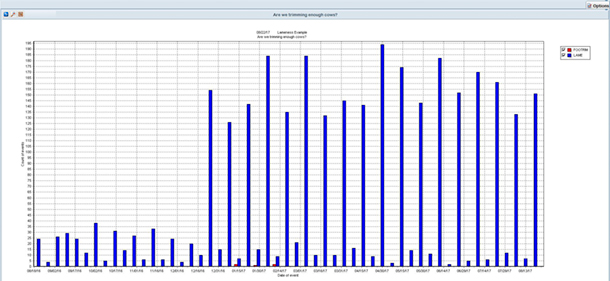
So when this herd looks at the graph, they should see at least 650 trimmed each month (Figure 1). You will see in the example the herd is trimming multiple times per month. Also, be sure to notice the “options” box in the upper right corner. This will allow you to make changes to the graph and look at different lactation groups and date ranges.
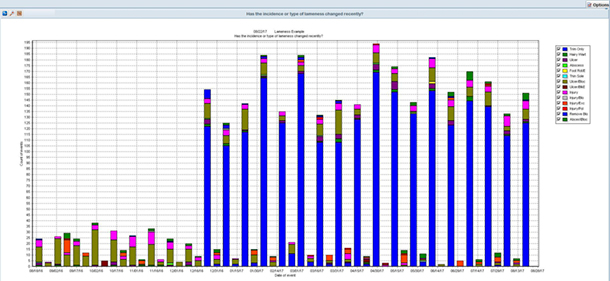
It is also important to monitor the incidence and type of lesions. This graph can also be found in GUIDE (Figure 2). This will help you see when there is an increase in incidence overall or a specific lesion. By clicking on the check mark by “trim only,” you can eliminate trims from showing on the graph so you are only looking at lameness incidences (Figure 3).
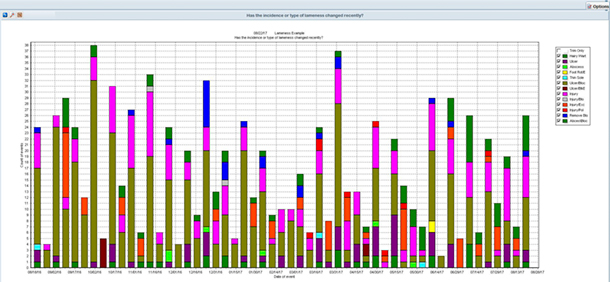
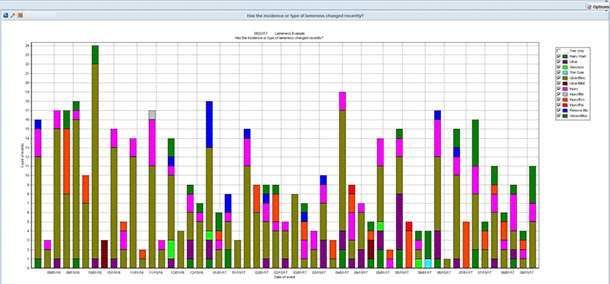
Now you can see months with higher incidence and that there are more hairy wart cases than in the past. Again, there is an options box to make changes to the graph. In Figure 4, I have taken a look at only second- and greater lactation animals. We can see most of the lameness is in this lactation group and most of the hairy warts are in this group as well.
You can also exit GUIDE and see the command that is used for this graph in the activity screen. If you double click on it, the command will go to the command line and you can make further changes to the command. This is helpful if you are trying to pinpoint where a problem is happening. Is it in a certain pen where the injury is happening, or overall herd? Looking at the graph in GUIDE that shows when the first lameness lesion happened can also be helpful in finding out the source of lameness and whether lameness is being monitored and found early, or only being found on foot trim day.
Having complete and accurate records will assist in evaluating hoof care, reducing lame incidence on the dairy and reducing economic loss due to lameness.
– Article submitted by VAS


