This month’s VAS DC305 tip is on how somatic cell count can affect production. Everyone is conscious of what their bulk tank somatic cell count is because in many cases, it affects the milk check received. But somatic cell counts also affect the level of production that an animal will have, which also affects the milk check but not in an as-obvious way.
There are two different numbers that can be looked at when discussing udder health. The first number is the somatic cell count of the animal. This is used when calculating the weighted average somatic cell count for the herd. To do this, each animal’s milk production is multiplied by their somatic cell count. That will give you the total cells for each animal that they are contributing to the bulk tank. You need to keep in mind that not all animals may be milked into the bulk tank, and you must use ECON in DairyComp to see the weighted somatic cell count. Cows included in ECON and not milked into the bulk tank will cause a difference between the herd SCC and the bulk tank SCC.
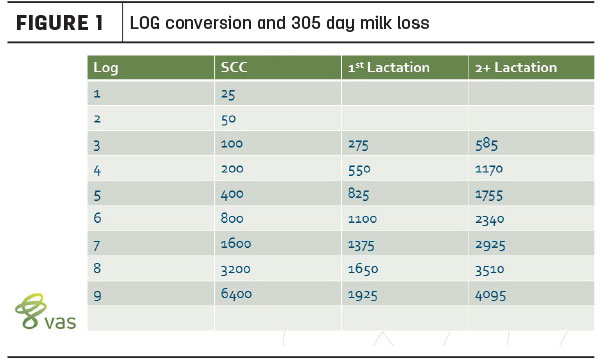
The other number that is looked at is the log or linear score. This is the one that should be looked at for the udder health of the animals. This number is the somatic cell count of the animals converted to a log/linear score. There is a direct correlation between the log/linear score and milk loss (see Figure 1). The milk loss due to poor udder health increases by 275 pounds for first-lactation animals and 585 pounds for second- and greater lactation animals for every increase of one log/linear score. This will help you see not only the possible loss of a premium for the milk sold, but also the milk that is being lost due to poor udder health.
Watching your bulk tank is not the way to monitor your somatic cell count. By the time you see an increase in your bulk tank, the problem is entrenched in your herd. One of the key things to controlling your somatic cell count is to monitor your new infections. If you can control your new infections and be proactive as soon as you see an increase in new infections, you can keep a low somatic cell count on your dairy.
In DairyComp a couple of reports to use for monitoring your udder health include:
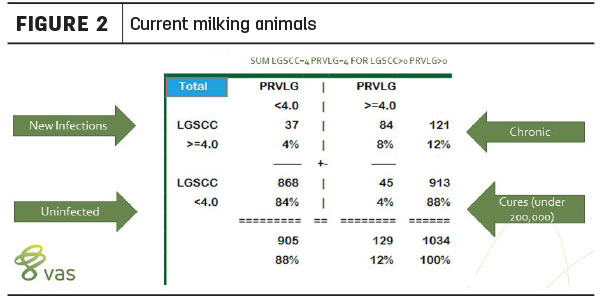
• Figure 2 is a summary 2-by-2 looking at current milking animals’ log/linear scores from last month to this month. Showing in the quadrants are uninfected, new infections, chronic and cures (under 200,00). You always want to see more cures than new infections.
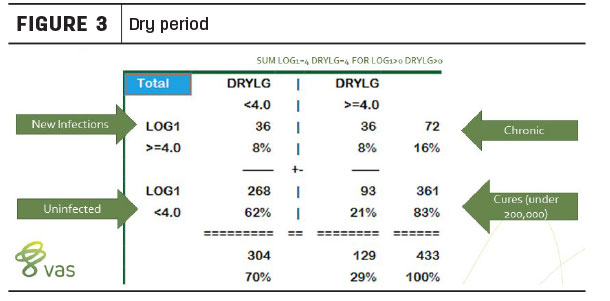
• Figure 3 is a summary 2-by-2 looking at whether animals are being cured (less than 200,000) during the dry period. You can use GUIDE under the Mastitis and Dry-off to look at the last six months as well.
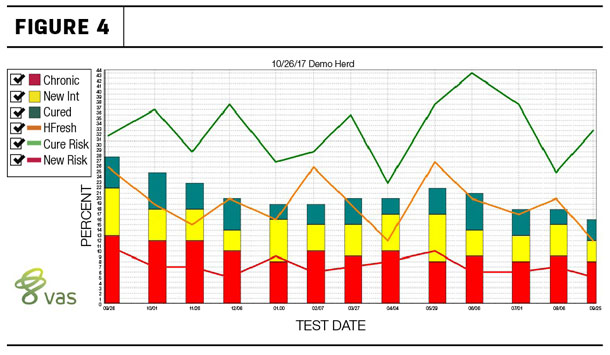
• Figure 4 is a graph showing a history of the herd over time and new infections, chronic and cures. You can also click on the report tab when you are viewing this graph and see the actual numbers that are graphed.
In summary, use log/linear scores when looking at the udder health of your dairy. There is a direct correlation between log/linear scores and milk loss. Monitor your new infections and be proactive when you see an increase in new infections before you see it in your bulk tank.
– Article submitted by VAS
See past tips here.
For more tips on tracking milk quality events in DairyComp, click here.


