In April 2010, AIPL began to make adjustments to PTAs on cows with genomic tests available. These adjustments were necessary because PTAs on highly selected, genomically tested cows did not improve accuracy of genomic predictions.
Genotyped cows are more numerous than genotyped bulls, which gives us the opportunity to make a significant addition to accuracy of genomic predictions if cows can be included appropriately. PTAs on genomically tested cows were rescaled to make them more like PTAs of bulls with similar pedigrees.
The adjustments made cow PTAs a useful addition to the discovery population and increased accuracy of genomic predictions, but also resulted in two types of PTAs on cows. PTAs for genomically tested cows were not comparable to PTAs on cows with no genomic information.
Beginning with the April 2011 genetic evaluations, AIPL will adjust PTAs on all Holstein, Jersey and Brown Swiss cows, whether tested with a SNP chip or not, to make the proofs more similar to bulls of similar pedigree merit. Only PTAs for milk, fat and protein and percents are affected.
This adjustment will follow animal model calculations and the adjustment to separate breed bases. It precedes steps where foreign dams, Interbull data and genomically evaluated animals are added. The all-breed animal model will be preserved, separate from these modifications.
One feature of the adjustment process is that adjusted PTAs on older cows will “propagate” in genetic evaluations of progeny, resulting in better estimates of parent average. Published proofs on cows without genomic scans will come from this program.
For cows with genomic data, adjusted PTAs will be used for genomic predictions. However, an additional adjustment is necessary to align evaluations of genotyped cows with those of genotyped bulls with similar genotypes before they can be used in the discovery population for genomic prediction.
This additional adjustment will replace the procedure implemented in April 2010. In the genomic evaluation, adjusted PTAs with this additional adjustment are used to update the parent averages of progeny. Published gPTAs on genomically tested cows will incorporate genomic information as in the past.
The adjustments to traditional cow PTAs will be applied to the Mendelian sampling (MS) portion of PTAs. “Regressed” MS is the difference between the PTA on a cow and her parent average or PA.
Production records and genetic evaluations of progeny supply the information used to estimate MS, while the regression depends on how much information is available from records and progeny. Regression is large for limited information but is reduced as more records and progeny become available.
The first step to adjustments of cow PTAs is to calculate an unregressed estimate of MS on each cow. The unadjusted PTA, PA and reliabilities of PTA and PA from the all-breed animal model after conversion to individual breed bases are used in this step.
The second step is to calculate a multiplicative adjustment to reduce the variance of unregressed MS so that cows have variance of MS similar to that of bulls with equal reliability of MS from progeny information. Reliability of MS is estimated from reliability of the original PTA less the reliability of PA for the cow.
It sounds awful, but is simple arithmetic. Research showed that cows had more extreme estimates of unregressed MS than bulls when reliabilities of MS were similar. There is no genetic reason for such a difference.
The adjustment for reliability was constrained to a maximum of 1.0. No cow PTAs are made more extreme by the adjustment for reliability of MS.
The third step is to account for differences between PA of a cow and the average PA of all cows born in the same year. Research showed that MS for bulls fell while MS for cows increased as PA increased compared to birth year average PA.
This result says that cows inherited more favorable genes than bulls as parents improved relative to birth year means, which doesn’t make biological sense. Both sexes are expected to receive similar gene samples.
Subtraction from unregressed MS of 0.434 times the difference between PA of a cow and average PA for cows in the same birth year brings the mean MS by parent average group for cows in line with that for bulls.
If a cow has a similar PA to other cows born in the same birth year, the factor -0.434 is multiplied times a small number, and little adjustment is made to MS. If the difference in PA and average PA for that year of birth is large, larger adjustments are made.
Notice that the adjustment is positive for cows below average PA (a negative times a negative number) but negative for cows above average for PA in their birth year (a negative times a positive number).
The fourth step to calculating adjusted PTAs is to combine the adjusted estimates of MS with PA to create an adjusted PTA. Adjusted PTAs “propagate,” in that adjusted PTAs on dams are used to calculate PA for their progeny.
While improved estimates of the genetic merit of a female are allowed to improve the estimate of pedigree merit of subsequent progeny, keep in mind that PA is an average of PTA of sire and dam. Thus any changes in PTA of the dam are halved in this process. Nevertheless, better pedigree information does affect the adjusted PTA of progeny.
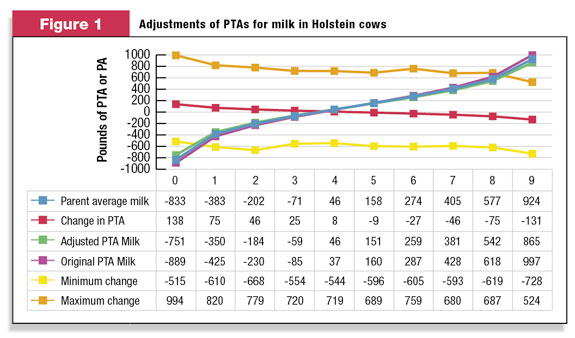
Changes in PTA of Holstein cows are shown in Figure 1 and in the values for average, minimum and maximum change in PTA and the unadjusted and adjusted PTAs. The cows contributing to the figure are Holsteins from the December 2010 genetic evaluations, placed into ten deciles based on PA, with over 275,000 cows per group.
The correlation between the current PTA for milk and the adjusted one is above 0.99, so changes in rank are expected to be small for almost all cows.
The graphs for original and adjusted PTAs, as well as average PA, for each group are very close. Adjusted PTAs are slightly higher than original PTAs for the lowest PA groups and slightly lower than original PTAs for the highest PA groups.
Standard deviations of adjusted PTAs of cows (not shown) are smaller than for original PTAs. Average adjustments to PTAs (change in PTA in the figure) are quite small for many cows in PA groups 3 through 6.
The range of adjustments for PTA milk shows that there are cows with substantial changes in PTA in every pedigree group. The greatest increases occurred in the lowest pedigree group, while the greatest decreases were in the highest pedigree group.
Adjusted PTAs will be used in the “discovery” population for genomic predictions, but research showed that adjusted PTAs were still slightly high for cows with genomic information available. The adjusted PTAs on genomically tested Holstein cows will be reduced by 221, 8.8 and 6.4 lbs of milk, fat or protein before using the PTAs in genomic predictions.
For Jerseys and Brown Swiss, the adjustments will be 195, 7.9 and 6.9 lbs of milk, fat or protein. These numbers are the difference between the adjusted PTA on genomically tested cows (by breed) and predicted PTA from their genomic scans.
The prediction equations used for this test came from an “all bull” discovery population, and would not include any bias from female evaluations. The subtraction of the above amounts from PTAs prior to use in the discovery population replaces previous adjustments to PTAs on genomically tested cows.
A simplified approach is sufficient due to the complex adjustments to original PTAs. It also helps to keep adjusted PTAs and genomic predictions of PTA on the same genetic base.
The correlation for milk for cows with traditional evaluations was 0.98 between March 2011 evaluations and evaluations on the same cows using the new adjustments. This correlation is affected by changes in the estimates of SNP effects due to the adjustment.
The bottom line is that with April 2011 proofs, PTAs on all cows are more like those on genotyped cows than for the past year. Owners of many genomically tested cows have already seen PTAs on their cows adjusted for MS scaling.
The new procedures will replace some of that adjustment but are not intended to produce more extreme adjustments. Generalizations can’t cover every situation. There will be some cows for which existing gPTAs do change for yield traits.
Genetic evaluations on genomically tested cows are processed through the traditional animal model and PTA adjustment programs, but published gPTAs combine traditional with genomic predictions.
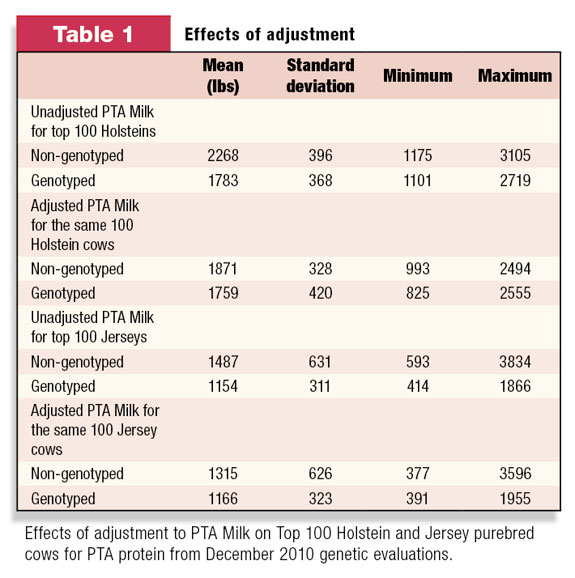
Table 1 summarizes PTAs for milk for the 100 purebred Holstein and Jersey cows with the best PTAs for protein, with and without genomic information, from the December 2010 genetic evaluations.
The top 100 non-genotyped animals have higher PTAs for milk than cows with genotype data. A number of top cows are in both groups, but many are not. Cows are genotyped in many cases for overall merit or for reasons other than exceptional transmitting abilities for yield traits.
Adjustment of PTAs on the top non-genotyped cows did bring the average of the top group in both breeds closer to the average of the top 100 genotyped animals. We expect this result because adjustments to MS which were applied to genotyped animals in the December 2010 genetic evaluations accomplished many of the same objectives as adjustments to traditional PTAs described here.
PTA for milk on the top 100 Holstein non-genotyped cows dropped from an average of 2,268 lbs to 1,871 lbs. Variation between cows, shown in the standard deviation of PTA Milk, also dropped from 396 to 328 lbs.
In Jerseys, non-genotyped cows dropped from 1,487 lbs to 1,315 lbs with the adjustment, while variation was essentially unchanged, with standard deviations of 631 and 626 before and after adjustment.
Extreme PTAs were reduced, especially the maximum values. These changes in PTAs occurred without additional records or progeny.
The top 100 genotyped Holstein cows changed much less than the non-genotyped cows, from 1,783 to 1,759 lbs with adjustment, while the standard deviation of PTA Milk on this highly selected group actually increased (368 to 420 lbs). Evaluations of individual cows did change, as the minimum PTA milk dropped from 1,101 lbs before to 825 lbs after adjustment.
The highest PTA milk among genotyped cows also dropped from 2,719 to 2,555 lbs. Average PTA milk of genotyped Jerseys actually increased from 1,154 to 1,166 lbs and became slightly more variable, as did Holsteins.
The top Jersey PTA for milk increased from 1,866 to 1,955 lbs, while the lowest PTA milk dropped from 414 to 391 lbs.
The adjustment of PTAs for yield traits in cows has some effect on bull proofs. Genomic predictions released in early March 2011, which used the old system, were compared to predictions using the new adjustments on over 24,000 Holstein young bulls.
Adjusted gPTAs for milk increased by 11 lbs, while fat and protein PTAs increased by less than 1 lb. Changes in the 11,700 predictor bulls were 29 lbs for gPTA milk and about 1 lb for PTA fat and protein. Effects of adjustment on individual bulls did vary, with a standard deviation of change of 100 lbs in gPTA milk of young bulls.
We should not find such variation surprising, as PA on some young bulls could change considerably with the new procedure. The correlation between unadjusted and adjusted gPTAs was 0.997 and 0.986 for predictor and young bulls. The adjustment procedure increased gPTA milk by 73 lbs in 2,000 young Jersey bulls.
What does it mean to dairy farmers?
Estimates of genetic merit from the adjustment procedure should be closer to true genetic merit. This is an especially important result for identification of outstanding animals that might be candidates for genomic testing.
Propagation of adjusted PTAs to progeny means that PA should be a better indicator of expected merit of animals prior to any data with which to estimate Mendelian sampling. Proofs on bulls should more closely resemble PA as progeny records enter proofs. Daughters of the best cows should perform more like proofs on their mothers.
Some individual cows are going to have lower PTAs because of this adjustment, even among those already adjusted because of genotyping. Dairy populations in Holsteins and Jerseys are large, with many different circumstances affecting the outcome of adjustment procedures on individuals.
But the overall result of the changes will be an improved method to identify outstanding females from traditional sources of genetic information – own records and progeny performance. The efficiency of selection programs will improve as cows will be ranked more accurately.
That is a winning situation for breeders, bull studs and, ultimately, for dairy producers who use A.I. but don’t concern themselves with genetic merit of individual cows. Finally, a fairness issue has been addressed by these changes. Genotyped and non-genotyped cows can be compared more fairly than was possible in 2010. PD
References omitted due to space but are available upon request to editor@progressivepublishing.com .
—Reprinted from original paper published for the Council on Dairy Cattle Breeding
George Wiggans is a research geneticist with the USDA Animal Improvement Programs Lab. His e-mail address is george.wiggans@ars.usda.gov

-
Bennet Cassell
- Profesor Emeritus
- Department of Dairy Science
- Virginia Tech
- Email Bennet Cassell