Paying attention to transition cow management pays obvious dividends through improved health, increased production and lower culling rates.

It can also have a significant impact on reproductive performance. Using AgSource’s Transition Cow Index (TCI), developed by the University of Wisconsin School of Veterinary Medicine, we have a very good measure of transition cow management.
Research attached to the development of TCI has shown that poor TCI scores generally result in lower production and increased early lactation culling. While this is expected, what does poor transition cow management mean to reproduction?
Are poor TCI scores also associated with difficulties breeding, resulting in longer days open? Let’s look at data on 675,000 lactation records, collected between 2009 and 2015, to answer these questions.
Analysis
Data from more than 675,000 Holstein lactation records was broken down into two parity groups:
- Cows transitioning from first to second lactation
- Cows transitioning from second to third, third to fourth, etc.
For each parity, the cows were broken down in six TCI categories.
- Category 1: cows scoring between -4,000 to -6,000 TCI
- Category 2: cows scoring between -2,000 to -4,000 TCI
- Category 3: cows scoring between zero and -2,000 TCI
- Category 4: cows scoring between zero and 2,000 TCI
- Category 5: cows scoring between 2,000 and 4,000 TCI
- Category 6: cows scoring between 4,000 and 6,000 TCI
Impact on production
Production results by TCI category are displayed in Table 1. As mentioned in previous articles, cows freshening with a poor TCI score tend to have lower peak milk production, later peaks and lower overall production during the subsequent lactation.
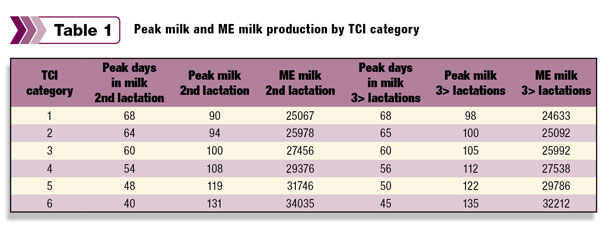
Second-lactation cows, scoring between -4,000 and -6,000 TCI, produce on average 41 pounds less peak milk and almost 9,000 pounds less milk for the lactation versus cows freshening with TCI scores between 4,000 and 6,000 TCI. Third-lactation and older cows showed similar differences in production numbers.
Impact on culling
When TCI was developed, research showed that in addition to production losses, herds with low TCI scores also showed higher fresh cow (those less than 60 days in milk) culling rates. To evaluate overall culling rates while taking into account the reproductive status, the dataset was broken up by cows listed as open versus pregnant at the time they were either to have been culled or completed the lactation.
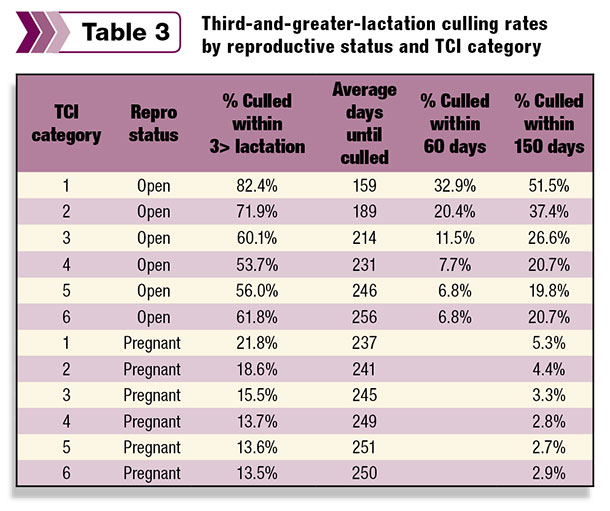
Table 2 shows the second-lactation cows’ culling rates by reproductive status and TCI category. Culling rates were broken up by 60 and 150 days in milk for open cows and 150 days for pregnant cows. Table 3 shows similar data for third-lactation and older cows.
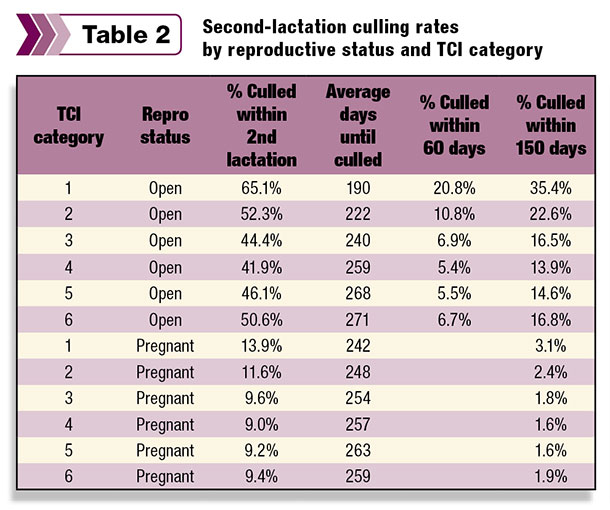
As expected, culling rates for cows that remained open during the lactation were much higher, and the decision to cull also took place earlier in lactation. Pregnant cows have lower culling rates than open cows. However, those cows that were coded pregnant and started the lactation with low TCI scores showed higher culling rates compared to those cows that started the lactation with a positive TCI score.
When reviewing the culling rates on third-lactation and older pregnant cows, almost 20 percent were culled even though they were confirmed pregnant.
The combination of age coupled with lower production levels likely leads to the decision to sell the cow versus risking another lactation with possible fresh cow problems and continued low production. In general, third-lactation and older cows were culled at significantly higher rates for both open and pregnant cows when compared to second-lactation cows.
Impact on reproduction
When assessing the impact of fresh cow management on reproductive performance, only cows that had 150 days in milk were included. Early lactation culls are eliminated from the dataset and therefore do not impact the measurement of reproductive performance.
To measure impact of poor fresh cow management versus a good fresh cow management program, cows were again broken up into the six TCI categories. The percent cows pregnant was calculated by TCI category and lactation group. Results are shown in Figure 1.
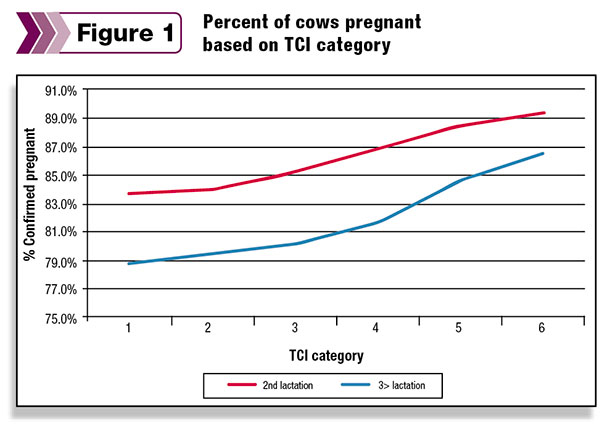
Figure 1 shows that as TCI values were lower, fewer cows became pregnant. Second-lactation cows with poor transition cow management showed 5 percent fewer cows becoming pregnant versus cows with excellent transition cow management. The difference was almost 8 percent in older-lactation cows.
When reviewing the number of times second-lactation open cows were bred, it ranged from 3.71 times bred for cows with low TCI scores (TCI category 1) to 4.23 times bred for those cows with high TCI scores (TCI category 6).
Based on cows with high TCI scores also producing more milk, it would be reasonable to assume that producers would continue to breed these cows longer. For third-lactation and older cows, the range was from 3.51 for low TCI scores and 4 times bred for high TCI scores.
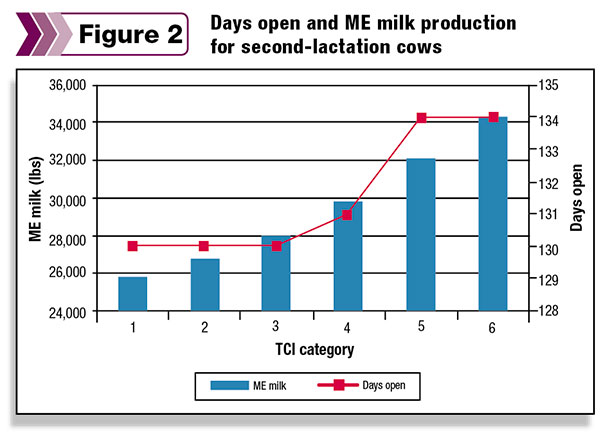
Pregnant second-lactation cows with low TCI scores versus those with high TCI scores showed little difference between the number of times bred (2.27 to 2.38) and average days to first breeding (80 to 82). Average days open as shown in Figure 2 are slightly lower on cows with low TCI scores (130) versus average days open for cows with good TCI scores (134).
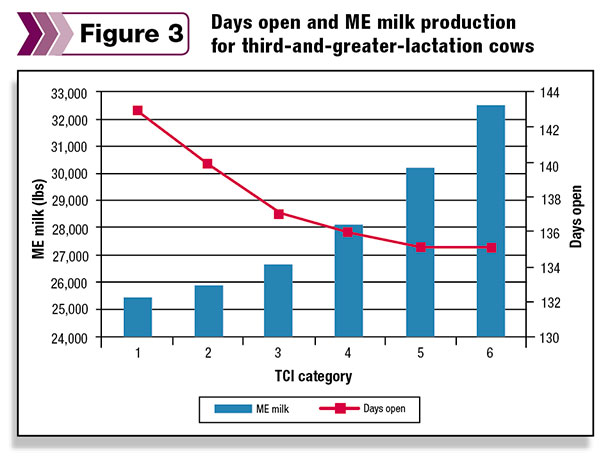
While the average times bred and average days to first breeding also showed little difference for third-lactation and older cows, there was a greater difference in days open (Figure 3). Cows with low TCI scores had an average days open of 143 days while cows with good TCI scores had an average of 135 days open.
Summary
Based on our data, second-lactation and older cows starting their lactation with poor TCI scores showed:
- Lower peak milk
- Delayed peak milk
- Lower overall lactation production
- Lower reproductive performance
On average, the percentage of cows that become pregnant increases as TCI values increase. Open and pregnant cows with low TCI values are culled at higher rates than cows with higher TCI scores, and older-lactation open and pregnant cows with poor TCI scores are culled at higher rates than second-lactation cows.
Take-home message
Measuring and monitoring transition cow management can provide the necessary information to determine how effective a herd’s transition cow program is both short term and long term. DHI data shows that making improvements will pay off in terms of higher production, lower early lactation and overall culling rates and improved reproductive performance. PD
Robert Fourdraine holds a Ph.D. in animal science from Texas A&M.

Robert Fourdraine
Vice President of DHI Operations
AgSource Cooperative Services
What is TCI?
Transition Cow Index (TCI) values are calculated using the end-of-lactation data gathered from the prior lactation and start-up lactation data (five to 40 days in milk) from the current lactation. A TCI value of zero basically indicates that the level at which the cow started her lactation is the same as what was projected at the end of her prior lactation.
A positive TCI value means the cow is performing better than what was projected at the end of her prior lactation, while a negative value means she is underperforming. Research has shown that improving TCI by 1,000 points equates to $250 more revenue per cow.


