The topic of inbreeding has received quite a bit of attention over the years. Trends by breed and the negative effect inbreeding has on the bottom line have been well documented.

Managing inbreeding is not a new concept, and Dr. Bennet Cassell from Virginia Tech University has described the effects of inbreeding in various papers.
The bottom line is: On average, inbreeding will reduce production, longevity and lifetime NM$ income. A 1 percent increase in inbreeding will cost 24 NM$.
A good mating program will take into account recessives and weigh each possible mating by calculating the projected added genetic value and subtracting the loss due to inbreeding.
For example, if a mating of a cow with Bull A (600 NM$) results in 5 percent inbreeding versus a mating with Bull B (500 NM$) results in 3.5 percent inbreeding, the mating with Bull A would still be economically more advantageous. In this scenario, the additional loss due to a mating with Bull A versus Bull B would be 36 NM$ loss (5-3.5 percent) x 24 NM$.
So what is new today?
The world of genomics has opened up new doors and has allowed A.I. studs to identify cows of higher genetic merit at an earlier age. By speeding up the selection process, they have been able to more rapidly release bulls of greater genetic merit and higher reliability. Table 1 shows inbreeding data provided by the Council on Dairy Cattle Breeding for recently genomically tested Holstein A.I. bulls.
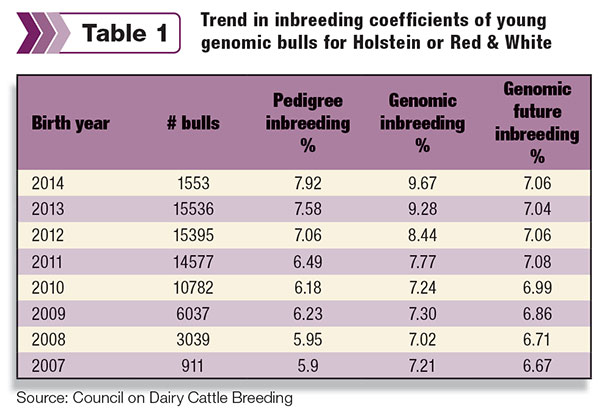
Table 1 shows an increasing genomic inbreeding percent for younger bulls, pointing at a population of sires that is becoming more related. Given this trend, how are producers able to make faster genetic progress while at the same time managing inbreeding in their herd? To answer this question, we need to determine if inbreeding is still an issue today.
Data was obtained using more than one million cows and heifers. Figure 1 shows the trend in inbreeding and NM$ for Holstein cows in the past 20 years.
Figure 1 shows that the NM$ values of cows by year of birth have increased by almost $500, but so has the level of inbreeding in Holstein cows (2.5 percent increase). Not only have inbreeding levels increased over the past 20 years, the trend is not showing any sign of leveling off.
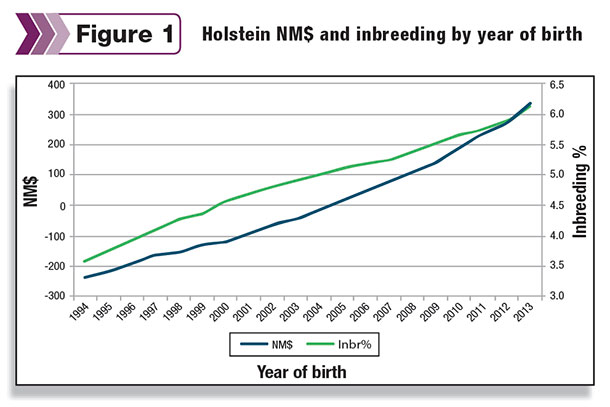
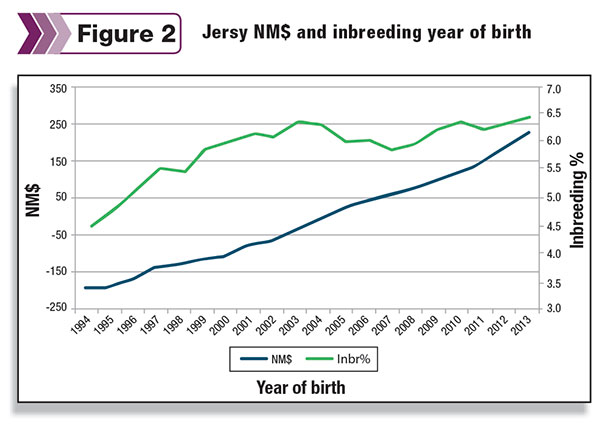
Figure 2 shows the same graph for Jersey cows. In the case of Jerseys, the NM$ increase is almost $450; however, the level of inbreeding has only increased by 2 percent and leveled off in animals born in 2003 and later.
With increasing levels of inbreeding in the Holstein breed, are their differences between herds as far as the amount of genetic progress made versus the inbreeding trend in those herds?
To answer that question, herds with inbreeding data were broken up into four groups (quartiles) based on the average inbreeding of cows and heifers born in 2011 and 2012. Quartile one are herds with the highest level of inbreeding, and quartile four are those with the lowest level of inbreeding. Figure 3 shows the trend of inbreeding based on the four quartiles and Figure 4 shows the NM$ increase for those same four groups of herds.
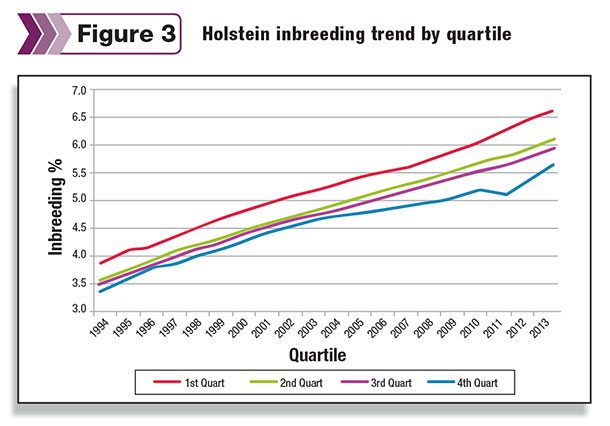
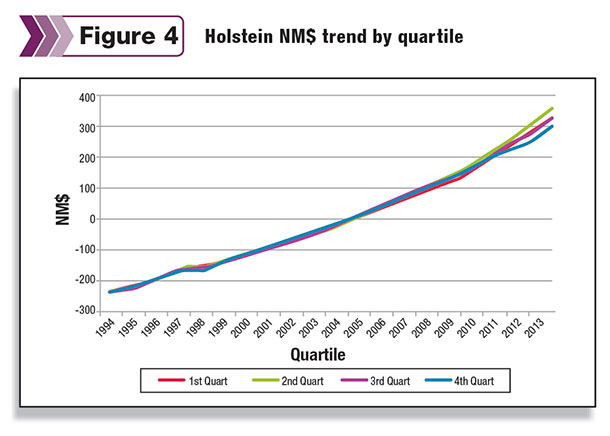
The combination of those two graphs demonstrates that all four quartiles showed a similar increase over the past 20 years; however, the herds with the lowest inbreeding level (fourth quartile) have run about 0.5 to 1 percent lower inbreeding percent than herds with higher inbreeding levels (first quartile).
In addition, no matter which quartile a herd is in, the amount of NM$ progress has been the same. In essence, herds that have managed inbreeding better have been able to achieve similar levels of genetic progress.
What is your level of inbreeding?
This may seem like a silly question, but have you monitored your inbreeding values? Most producers will say “my A.I. company manages inbreeding for me when they mate my cows.” That may be true, but a lot of factors go into the mating recommendation, and there can be major differences between the recommended mating report and what winds up being the actual sire of a calf.
The final determination of how inbreeding is managed has to be made based on the sire and dam of the calf. If you have not reviewed your inbreeding information, then asking your DHI service provider or breed registry might be a good place to start. There are a couple of things you need to find out.
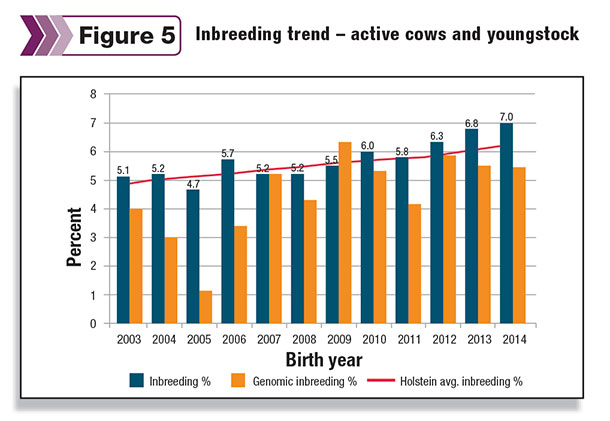
What are the inbreeding values for animals by year of birth and how do they compare to the average for the breed?
The answer to this question helps paint a historic picture of how you have managed inbreeding in your herd. Figure 5 shows an example of a Holstein herd, comparing their inbreeding values against the national Holstein breed averages. Although the herd’s inbreeding values have increased, they have done so at the same rate as the average Holstein cow has nationally.
What is the distribution of cows and heifers based on inbreeding level?
This question addresses the distribution of inbreeding percentage, not the average. By comparing against a typical distribution of all other herds, this information should tell you if you have a higher percentage of cows that are highly inbred, and if so, was that a result of intentional breeding, a breeding mistake, a recording mistake or not following a recommended mating report.
Figure 6 shows an example of one herd’s inbreeding distribution comparing it against other Holstein cows. Results show that there is only one cow in the high category and the herd has done very well keeping the number of highly inbred cows at a low level.
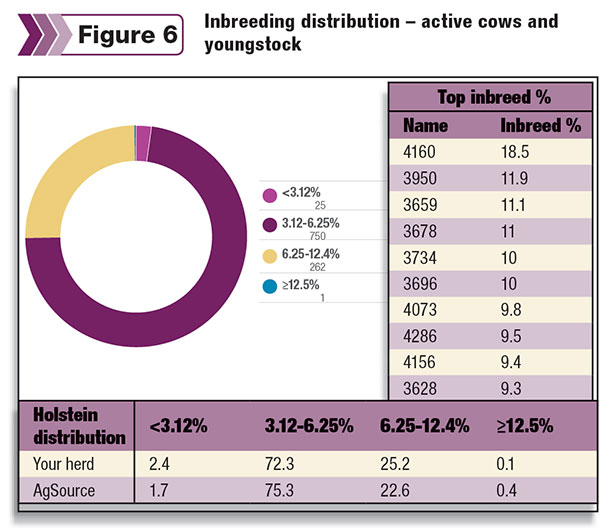
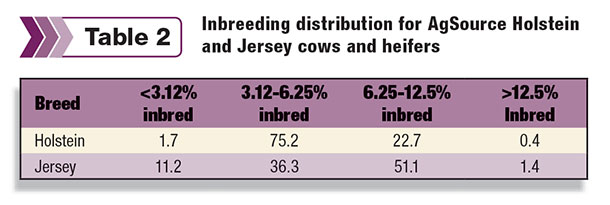
Table 2 shows the May 2014 inbreeding distribution of active cows and heifers for both Holsteins and Jerseys. These figures are used as benchmarks for the herd to compare against.
What sires have made the greatest contribution to my herd’s genetics?
This question is directed at establishing which sires (sire, maternal and paternal grand sires) have the greatest genetic impact on the herd. A high prevalence of a certain sire would pose a greater risk of inbreeding if the service sires selected are directly related to this bull.
Table 3 shows an example of the top genetically represented sires in the herd. Most producers will have a list of the service sires they have bred their cows to, but the ones that generally surprise producers are sires that have a lot of paternal granddaughters because they used service sires that were sons of that same bull.
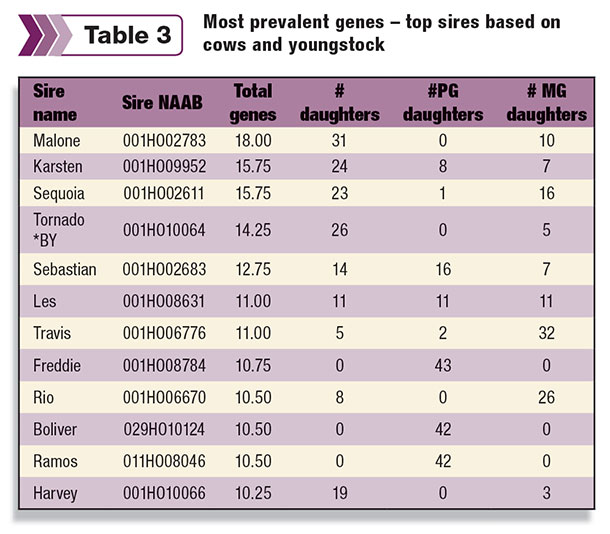
For example, Table 3 shows three sires (Freddie, Boliver and Ramos) that have had a significant impact on the herd but were not used as service sires.
What can I do going forward?
Managing inbreeding starts with maintaining good records. The better parentage records are, the better job a mating program or analysis program can do in terms of calculating an estimated inbreeding percentage and measuring genetic progress.
The following are some tips to ensure genetic and inbreeding information and can be obtained through DHI providers and the Council on Dairy Cattle Breeding, and that data is available for mating programs to manage inbreeding.
- Apply an official I.D. to each calf at birth and record the official I.D. in your herd management software or provide to your DHI technician.
- Record the sire and dam correctly. For the sire, enter NAAB codes, not names. For the dam, record the official I.D. number of the dam, not just the management number.
- When breeding cows, make sure to record the correct service sire NAAB code. Don’t enter a name.
- When the cow freshens, make sure to match the correct calf with the cow. Most mistakes are made here and will lead to bad data.
Once you have accurate I.D. records in place, you have the data that will allow your DHI or breed registry to work with you to evaluate your overall genetic and inbreeding program and continue to monitor future progress.
Providing the I.D. records to your A.I. representative will allow them to use these in a mating program and minimize the impact inbreeding will have in the future. In addition to managing inbreeding, some A.I. companies have added focus on finding diverse pedigrees while increasing genetic merit to improve producer profitability.
Herds that genomic test can obtain the genomic inbreeding percentage, which would mean an actual measure of those genes that are in common.
If genomic data is available, check to see if your genomic inbreeding percent is lower or higher than the traditional pedigree- based inbreeding percentage calculations. If the values are lower, that would indicate that the impact of inbreeding would be less than previously estimated.
To summarize, inbreeding is still on the rise, but tools are available to monitor what is happening in your herd, and if you use those tools, they will assist you in making breeding decisions that maximize genetic progress while limiting inbreeding. PD
Robert Fourdraine holds a Ph.D. in animal science from Texas A&M.
References omitted due to space but are available upon request. Click here to email an editor.

-
Robert Fourdraine
- Vice President of DHI Operations
- AgSource Cooperative Services