Colorful infrared images of bunk faces have become all the rage with consultants and sales people wanting to promote forage quality and silage additives. One company claims that infrared cameras can show the value of inoculants. Another may state that an infrared image can reveal how well a bunker is packed and covered. Someone else may suggest that infrared images tell only a fraction of the silage quality story.

So who is correct? The truth is, each of the above statements have validity. The true value of infrared imaging boils down to the interpretation of the data and not just the color and temperature variation revealed on a report.
Infrared imaging reveals a lot of good information, but surface exposure to sunlight and other factors can influence results. However, internal temperatures measured by a probe seldom lie.
A good case in point was well illustrated at our company’s booth during this year’s World Dairy Expo in Madison, Wisconsin, this past October. In an effort to promote accurate interpretation of infrared reports, we showed two contrasting reports. One showed a beautiful bunker of haylage as analyzed by infrared imaging – but when internal temperature data was gathered, a totally different story emerged.
The other report showed an infrared image of a bunker that looked like a disaster waiting to happen. However, when internal temperatures and faced feed temperatures were measured, the bunker proved to be very aerobically stable.
While we still believe infrared images can reveal a lot of good information, over the past few years we have been adding internally probed temperature data to help tell a complete story. Let’s take a look at these two examples.
Focusing attention only on the infrared image above the bunker photo of earlage (see photos below) , we can only assume we’re witnessing a train wreck. The face colors look more like a colorful kaleidoscope than a stable bunker of feed. This is a very wide bunker, at least 120 feet across the face, and it takes four to five days to deface the entire width.
That defacing pattern is clearly revealed with vertical infrared color differences. Also, notice the streak of
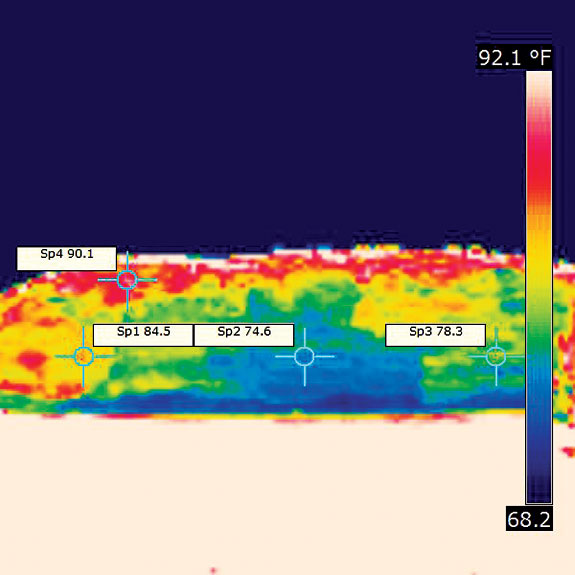
red/pink/white coloring just under the plastic top cover, indicating relatively warm feed. Surely the feed coming from this bunker is aerobically unstable, will come out of the bunker hot and become even hotter as it sits in a feedbunk.
Now let’s look at the data. The range in face temperature as measured by infrared camera is 15.5 degrees. The coolest spot on the face is 74.6 degrees and the warmest 90.1 degrees. We like to see this range no more than 15 degrees, so it’s only slightly higher than spec.
On this report we can see that internal temperatures were probed at three locations on the bunk – (L) left, (C) center and (R) right – at depths of 18 inches and 4 inches. In addition, remaining faced feed was probed. It should be noted that this image and the internal temp probes were taken at about mid-day on a 90-degree, hot and sunny day, approximately six hours after the last feed was removed.
Now a totally different story is revealed. Internal 18-inch depth temperatures of 90, 89 and 76 are perfectly acceptable and indicate no particular problems in this bunker. The 4-inch depth readings at 82, 89 and 79 degrees are encouraging because now we know that the feed just beyond the surface and which will be coming off next is not heating and appears very stable.
And best of all, the faced feed that has been laying in the hot sun for nearly six hours is measured at a relatively cool 72.5 degrees. How is it possible that feed tends to be cooler as it nears the surface of the bunker and is even cooler as it lays in a pile at the base of the bunker?
Part of the answer has to do with cool early-morning ambient temperatures. Feeding often takes place early in the morning when outside temps are cool. When the feed is defaced, it is exposed to the cool morning air and the feed temperatures drop.
The other part of the answer on this particular bunker involves the inoculant treatment. It was treated with a combination inoculant containing an upfront fermentation bacteria and an L. buchneri bacteria to enhance aerobic stability.
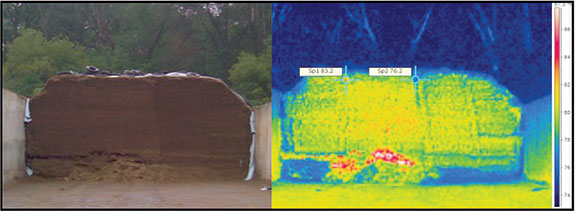
In contrast to the above bunker report, we also showed a bunker at World Dairy Expo that told the opposite story. The infrared image looked great, but the internal temperature data revealed some issues ( Haylage photos ).
As we did before, let’s once again focus on the infrared image. The face of this haylage bunker shows a very consistent face with the warmest reading of 83.2 degrees and the coolest, 76.2 degrees – a very desirable face range. At first glance, this infrared image is nearly ideal.
The top of the bunker under the plastic looks perfect, there are no hot spots in the upper corners and overall the face looks great. But when we take a closer examination of the infrared image we start to see some hints of a problem. Notice the white and red hot spots low in the center.
This could be mistaken for some heated faced feed, but when the digital camera image is examined very closely, the hot spots are actually revealed as internal feed that has been exposed by small cave-ins. A small section of the face has fallen away and the very warm internal feed is showing up as a hot spot.
Turning to the 18-inch internal temperature readings, it is clear that there are some fermentation issues with this bunker. These temperatures were recorded long after the feed went into this bunker, so even though we often see a 10-to-15-degree spike in feed temperatures during initial fermentation, this feed should have stabilized by the time of this data recording.
Internal temps of 101 to 105 degrees are a pretty good indicator of aerobic deterioration. Some consideration has to be made regarding the ambient air temperature on day of harvest because those temperature can be retained for a long time. But these readings are too high.
Limin Kung from the University of Delaware suggests that when this secondary heating occurs it is often a result of penetration of air into the silage mass, which allows yeasts to metabolize lactic acid. As a result, silage pH increases, allowing molds and opportunistic bacteria to thrive. Kung further states that internally measured temperatures in excess of 100 degrees 4 to 8 inches in back of the silage face indicate aerobic spoilage.
This report is a classic example of what Kung describes. Possible causes include forage that may be harvested too dry or coarsely chopped. Maybe the bunker wasn’t packed well or covered immediately.
Based on these two examples of actual infrared image reports, we want to be sure to dig a little deeper than simply taking the information at “face value” when viewing these reports. The color images are attractive but may not reveal the entire story. Internal temperatures don’t lie and quite often fill in the information gaps left by simple infrared photos. PD
PHOTO 1,2: Earlage: The color images are attractive but may not reveal the entire story. Internal temperatures don’t lie and quite often fill in the information gaps left by simple infrared photos.
PHOTO 3: Haylage: This infrared image is nearly ideal. But when we take a closer look at the image we start to see some hints of a problem. Photos courtesy of Jon Urness.

-
Jon Urness
- Nutritionist
- Vita Plus Corp.
- Email Jon Urness