On-farm variation is a hot topic. Forages, commodities or grains, TMR mixing and delivery, and cow level sorting are sources of variation that change the diet cows eat from that directed by a nutrition consultant. There are many opportunities to improve and gain in each of these areas. Focusing on forages alone, it’s been long understood that dry matter varies, and hopefully measures are taken to control the variation.

The dry matter variation story continues to evolve, but professors Bill Weiss and Normand St-Pierre recently presented compelling work demonstrating that fiber and starch levels varied day to day more than dry matter. This novel observation should cause us to pause and reflect.
The gold standard
As an industry, we aim for a thumb rule of less than 5 percent variation for the TMR. This gold standard is based upon feed industry mixer tests and extrapolated to TMR mixers. However, do you have any concept how variable your on-farm feedstuffs are in relation to the gold standard?
If feedstuff (forages or commodities) variation is not accounted for, can we expect to maintain a quality control standard of less than 5 percent variation for rations on-farm?
We understand that forages are variable. Hence, dairy owners and consultants measure nutrient and digestibility “routinely.” But what is your on-farm routine? Routine could mean monthly to one consultant and dairy, or weekly to another.
As a consultant, I historically sampled forages every three to four weeks when on-farm, then made diet adjustments as forages and nutrition opportunities dictated. Is this approach the best for cow health and performance?
Possibly not, considering the six-unit to 10-unit coefficient of variation (CV) in corn silage NDF and starch levels that Weiss and St-Pierre observed. Weiss and St-Pierre further suggested the nutrient variability could be large enough to impact rumen function.
Referencing sound research is one way to tell this story, but the point was driven home for me based on a recent experience with a 1,250-cow dairy in the Midwest. I now stand convinced that we need to embrace professor Weiss and St-Pierre’s work and guidelines, and re-evaluate our approach.
A 1,250-cow Wisconsin dairy story: Forages, sampling approach and week-to-week changes
This family dairy took an advanced approach to sampling forages, assessing corn silage and alfalfa haylage quality nearly weekly after the harvest season in 2013.
The dairy and consultant used this information to continuously evaluate forage changes and diets. Beyond the research discussed previously, I had not seen a data set like this and took liberty to work with the dairy and consultant, and further assess week-to-week changes.
What we observed was astounding.
Overall, the results across the past feeding year were in line with Weiss and St-Pierre’s findings. In Table 1 , the nutrient results over the past year varied substantially.
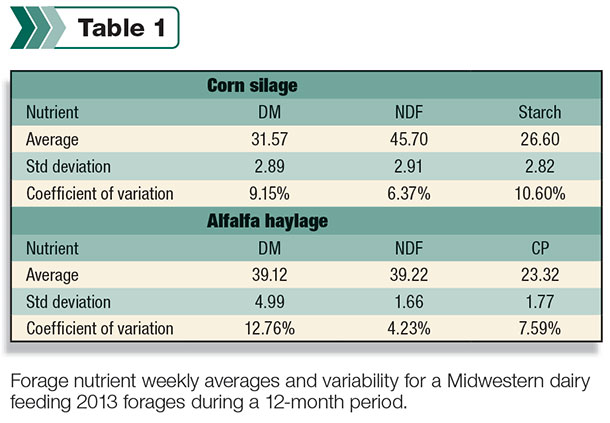
Table 1 demonstrates greater than 5 percent variation for nearly all parameters within the year; yet, subjectively, I did not feel the table adequately depicted how results changed from week to week.
I often use data, economics and partial budgets to demonstrate challenges and opportunities on-farm; however, to demonstrate the dramatic variation described by Weiss and St-Pierre and specifically observed on this dairy, I’ll use raw graphs showing forage analysis results over time.
Forage dry matter (moisture)
As expected, forage dry matter content changed over time for alfalfa haylage, but what I didn’t expect were the substantial differences in corn silage moisture over time ( Figure 1 ).
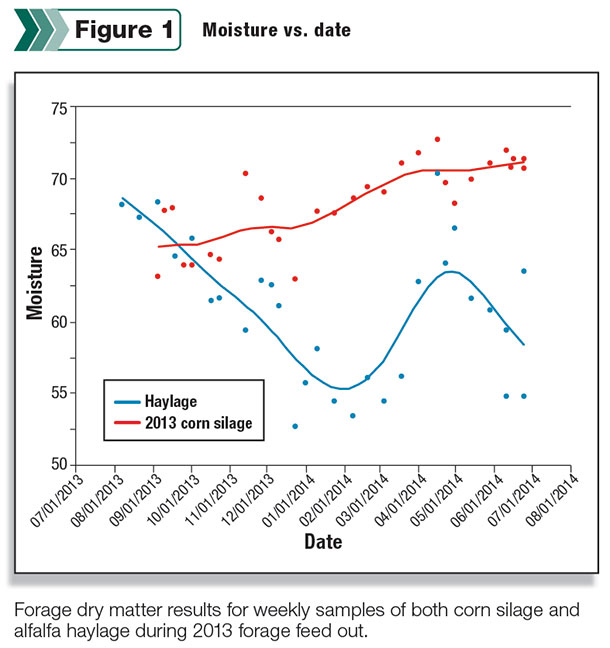
This was likely attributed to feeding the latest-harvested feed first and then moving toward less mature feed during the year. This graph helps confirm that forage dry matter content should be monitored closely, several times per week.
Forage fiber (NDF) variation week to week
The dairy in this story harvests between 12,000 and 14,000 tons of corn silage each year and stores the forage in two well-packed and sealed piles on concrete pads. Considerably less alfalfa haylage is harvested but also stored on the concrete pad in one or two piles. The dairy historically harvests high-quality corn silage and alfalfa haylage and packs the forage into silage piles using a progressive wedge strategy.
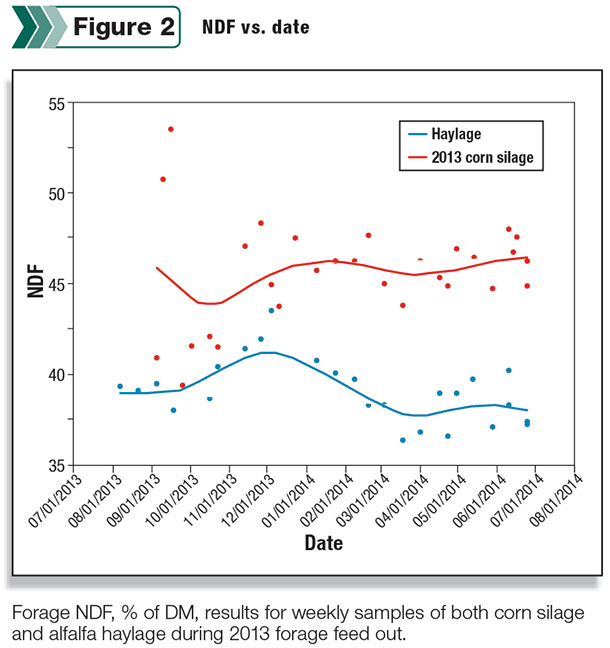
I had assumed relative feed consistency within bunkers or piles given the blending nature of harvest, pushing and packing. While some weekly samples were reasonably consistent with the week prior, many weeks’ samples differed by three to four units of fiber (roughly 8 to 10 percent variance) from the prior sample for both corn silage and alfalfa haylage.
A four-unit change in corn silage NDF when feeding 60 pounds silage corresponds to roughly 2 pounds difference in milk production. I often focus on TMR NDF levels when troubleshooting, specifically forage NDF, so this NDF variability is worth capturing.
Forage starch variation from week to week
The most striking observation across the 12-month period year related to starch. Figure 3 demonstrates substantial changes in grain level from one week to the next for this dairy’s 12,000 to 14,000 tons of 2013 corn silage.
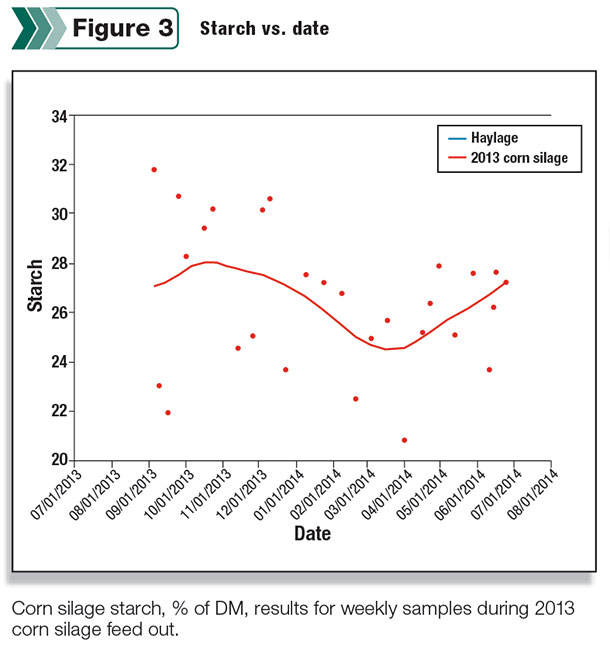
The results varied so noticeably that the dairy sent split samples to the laboratory to confirm nutrient measures were accurate (confirming variation was due to on-farm sampling or feed).
Starch content from one week to the next varied as much as 10 units. On-farm sampling could have added to variability. Dr. Tom Oelberg recently suggested to me that the ideal approach to sampling and feeding cows is to remove enough silage for the day’s feeding, then push forage to a central feeding point and turn feed over by picking up and dumping with a loader.
The pickup-dump action acts similar to your mixer and blends feed. After appropriately blending the forage, feeding or sampling can commence. Does your dairy take this approach? The added effort will pay off.
For the dairy in the example here, the forage is pushed to a central pile, yet the inconsistent nature from one sample to the next continued through feeding 2013 corn silage. Monthly (or even biweekly) sampling likely did not describe the true forage nutritive value contributed to the TMR each week.
Consider a five-unit change in silage starch from one week to the next; this difference accounts for slightly more than 1 pound corn grain. What value would that have for your dairy?
Ultimately, our aim is to feed dairy cattle more precisely – improving consistency, health and performance. Based on experience, I previously understood forages to vary but not to the extent demonstrated by the referenced farm and described by Weiss and St-Pierre.
Was 2013 forage more or less variable than prior years? Possibly. Does sampling introduce some variance? Probably. Does the feed account for more of the variation shown here? Probably.
Does your dairy capture potential hidden variation or true feed nutritive value? I personally see opportunities on many farms with many consultants I have the opportunity to support.
Can your dairy achieve less than 5 percent TMR variability from one week to the next? There are many error sources contributing to different diets fed relative to those prescribed.
Yet when focusing on forages and feeds, following the guidelines outlined by Weiss and St-Pierre, including using a sample average of each feed for diet formulation, may help you gain in performance.
Work with your consultants to develop protocols that work best for your dairy and consider extra efforts to ensure representative samples. PD
John Goeser earned a Ph.D. in animal nutrition from the University of Wisconsin – Madison where he currently serves as an adjunct professor in the dairy science department. He also directs animal nutrition, research and innovation efforts at Rock River Lab Inc. based in Watertown, Wisconsin.
References omitted due to space but are available upon request. Click here to email an editor.

John Goeser
Director of Nutrition, Research and Innovation
Rock River Laboratory Inc.