
The 2019 corn crop seems like my preschool- and kindergarten-aged kids, evolving and changing from day to day with new experiences. Yet there are now enough samples in the feed analysis laboratory databases that we can draw summaries for the season.
There were multiple different factors at play for farm-grown forages and grains in the silos. The growing season was tumultuous for many. Delayed or prevent plant situations resulted in variable crop emergence. Then, continued wet and cooler weather as the season progressed equated to growers recognizing substantial variation in yield and quality within fields. Later, the harvest season proved to pour added challenges for many, with cooler wet weather delaying or preventing crop maturation and harvest.
As mentioned above, there were considerable corn and soybean acres standing for the holidays. With the desire to not focus on the challenges but gather the information we now have in hand and project resulting nutritive quality, let’s review the crop nutritive value for many U.S. dairies.
Corn silage crop quality for East to West growers
A majority of energy per ton comes from fiber and starch in silage and swings in performance result from changes in both nutrient content (i.e., grain-to-stover ratio) and nutrient digestibility (fiber or starch digestibility). Thus, we can take a look at energy value per ton for samples submitted to date by comparing and contrasting several growing season results for Eastern, Midwestern and Western dairies.
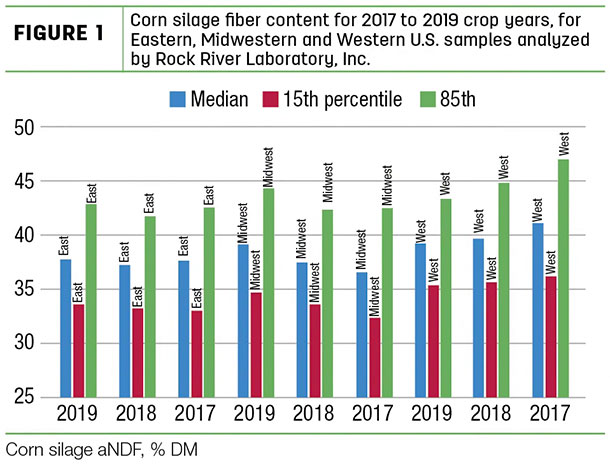
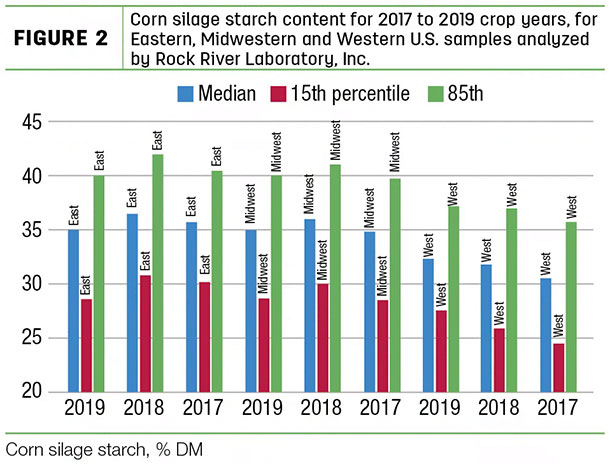
The statistics tool within the www.rockriverlab.com client portal provides a quick and efficient way to run database queries for all samples analyzed by Rock River Laboratory. In about 10 minutes, I was able to generate the data table needed to put the following graphics together for discussion and evaluation. Figures 1 through 4 are all presented in a similar fashion, with the median nutritional value highlighted in blue and then the 15th and 85th percentiles shown in red and yellow, respectively.
For eastern U.S. dairies, fiber content is slightly up (Figure 1), with grain and starch yields slightly down (Figure 2) for 2019 corn silage relative to 2017 or 2018.
These factors equate to less energy per ton because fiber always carries about half the energy starch does. Then combine this observation with slightly lesser fiber digestibility (Figure 3) and slightly increased rumen starch digestibility (Figure 4); we should expect a slight drop in quality on average for 2019 silage relative to the prior two crop years.
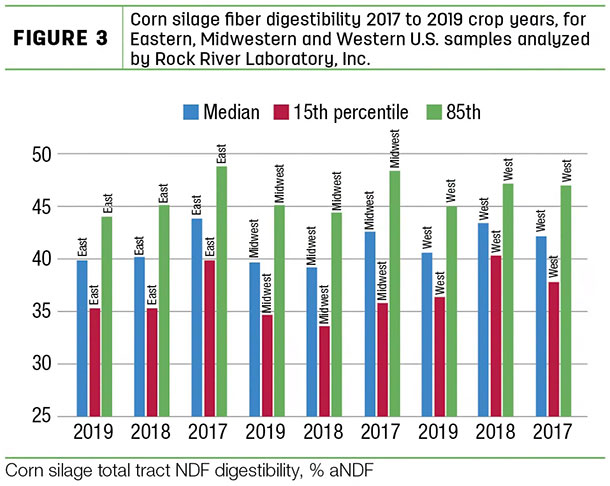
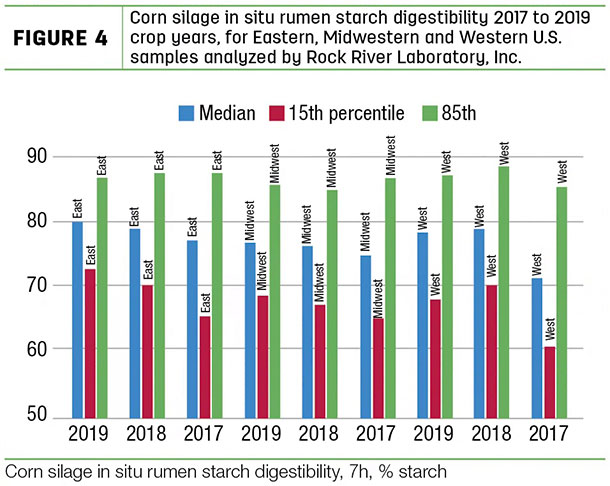
For mid-western U.S. dairies, the trends are similar to the East – however, with a more pronounced increase in fiber content (Figure 1) with less grain per ton (starch content, Figure 2) and tough growing conditions recognized for many in this region. Fiber and starch digestibility appear slightly increased for 2019 relative to the prior two crop years, somewhat offsetting the potential energy losses per ton due to fiber-to-starch ratios. However, the overall quality trend appears to be a slight drop in quality for the Midwest as well.
For western U.S. dairies, the 2019 crop bucks the trends portrayed by samples for the rest of the U.S. as we recognize greater starch content and less fiber (Figures 2 and 1, respectively). Fiber digestibility has trended down slightly; however, starch digestibility appears to have offset the fiber quality dip, and in general we should expect better quality for 2019 Western silages.
Evaluating average begins to tell a story as the variation in the data should also be considered for year-over-year trends. There continues to be widespread forage analysis results across the U.S., with the only meaningful deviance appearing to be less spread (range from 15th to 85th percentiles) to the corn silage quality results for Western dairies and growers. This is logical, recognizing that many have corn under irrigation and thus are likely in a better position to manage quality through environmental factors.
With quality trends and variation discussed, recognize these comments relate to nutrition analyses and potential; however, we did not consider or discuss anti-nutritional. These are the curious factors alluded to previously. Undesirable feed hygiene factors are at play for many due to factors beyond our control (environment). With ear and stalk rots having come on strongly during the back half of the growing season, mold, wild yeast, mycotoxin load and potential bacterial contamination from soil or mud could be factors that rob your cows from capturing the full energy value per ton. Consult with your nutritionist and veterinarian if dairy performance and feed efficiency are not up to expectations relative to both your results and those presented here. ![]()
John Goeser earned a Ph.D. in animal nutrition from the University of Wisconsin – Madison where he currently serves as an adjunct professor in the dairy science department. He also directs animal nutrition, research and innovation efforts at Rock River Lab Inc. based in Watertown, Wisconsin.

-
John Goeser
- Director of Nutrition, Research and Innovation
- Rock River Laboratory Inc.
- Email John Goeser


