The dairy industry is known for using a lot of metrics. There are reproductive metrics, financial metrics, production metrics and nutrition metrics. In the best cases, metrics help us make decisions and justify the decisions we make.

They give us an indication of the benefit or the lack of benefit of doing some particular action. These metrics are rarely stagnant. As the industry evolves, the metrics we rely on change to meet modern efficiency standards.
A good example of this change is the evolution from days open to pregnancy rate as a reproductive metric. Before the industry adopted pregnancy rate as the standard, days open was considered a useful metric. We watched days open to ensure it didn’t get too high, and the time between pregnancies was kept to a minimum.
However, what often happened was: If cows with long days in milk got pregnant (good), the days open went up (not good). The metric was not always an indication of the reproductive efficiency of the herd. Pregnancy rate was adopted because it showed how fast cows eligible to be pregnant did get pregnant. When cows got pregnant fast, it went up (good). When they didn’t get pregnant, it went down (not good).
This kind of evolution has also happened with financial and nutrition metrics. There are several metrics we use to evaluate feed cost and how it impacts performance. The most common are feed cost per hundredweight (F$/cwt), feed cost per cow (F$/cow) and income over feed cost (IOFC). All three are useful, and all have a value in decision-making. However, F$/cwt and F$/cow don’t tell us the whole story alone. They are useful metrics to consider how well you did procuring feedstuff but don’t give an idea of the profitability of a production response. IOFC is the metric that ties nutrition to profitability.
IOFC is a decision-making tool for feeding decisions and evaluating changes in the feeding program. The basic definition of IOFC is the dollars left for other expenses like labor and maintenance after lactating cow feed cost. It can be done on a herd basis, pen basis or even for an individual cow.
Formula for IOFC
The formula for IOFC is income from milk minus the cost of lactating cow feed. Because IOFC is an efficiency ratio measuring income over feed costs, we only include the feed costs associated with the cows that produce income or the lactating cows. This can be an important distinction when IOFC is compared to other metrics. IOFC is an indicator of cash flow and an efficiency measure that allows you to gauge changes in your lactating cow ration.
IOFC can be used for:
- Ongoing evaluation of the available dollars for other expenses
- Measuring the impact of a change in feedstuffs
- Evaluating the profitability of a feed additive
Using IOFC versus F$/cwt and F$/cow
Let’s dive a bit deeper into the different nutrition metrics we’ve mentioned. F$/cow or F$/cwt can be used to decide if a feeding strategy is a good idea or not. Producers will say things like, “I want to drop feed cost per cow by 30 cents” or “My neighbor’s feed cost per hundredweight is a dollar less than mine,” and they will use the F$/cwt and F$/cow metrics as justification for lowering feed costs. While both of those metrics may be worth considering, not evaluating the results of those changes using IOFC can have the opposite result if you are looking to increase profitability.
In Table 1, we’ve created a comparison of the different metrics based on a five-cow herd. (The same math works for any size herd.)
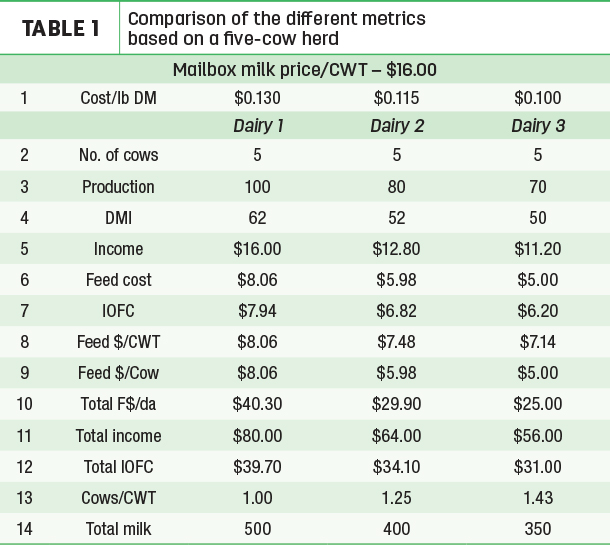
In each comparison, the cows have different production levels and feed costs. The cost per pound of dry matter (DM) is different because of the nutrients needed to support the levels of production. In all three scenarios, the dairies receive the same mailbox price for milk.
When you consider this table, the dairy with the highest IOFC also has the highest F$/cwt and F$/cow (lines 7, 8, 9). The number of cows needed to produce 1 cwt of milk is less in Dairy 1 (line 13), and the total milk produced is more in Dairy 1 (line 14). Total feed cost is higher, but so is the total income and IOFC; overall profitability is up.
However, when considering this example and its implications, we are not saying you should drive up feed cost in your herd, and you will increase profitability. Instead, evaluate each additive and feedstuff decision to make sure it is paying for itself and adding to the dollars you have left.
This spring, we experienced low milk prices and lack of demand from processors, which may have left many producers feeling like more milk production is a bad thing. The milk has to go somewhere, or it isn’t worth anything. The reality is: Higher IOFC provides more dollars for other expenses to be paid regardless of the milk price.
Evaluating added ingredients with IOFC
We often are told to add an ingredient to the diet that will make more profit for the dairy. These additives often do make a difference, but they should be evaluated using IOFC to determine precisely what that difference is. Let’s take Dairy 2. They are adding an ingredient that adds 20 cents to the cost of the ration, and they want to determine if it increases profitability (See Table 2).
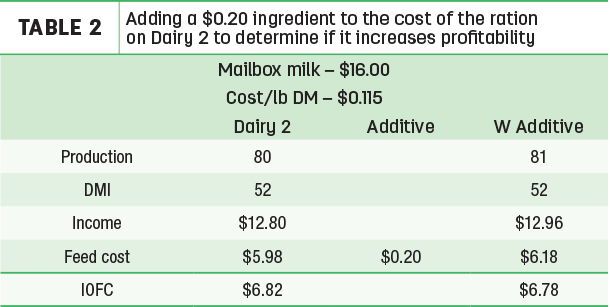
What we see in this scenario is that there was a 1-pound milk response and an increase in income and feed cost. The IOFC dropped 4 cents. The result of feeding the ingredient was a decrease in dollars to pay the non-feed cost, which is obviously not a good thing.
Indexed IOFC with a consistent milk price
One of the challenges with our example is that milk price seldom is consistent from month to month. Calculating IOFC like it is could create misleading results. In Table 3, we re-evaluated the additive with a milk price increased by 50 cents per cwt.
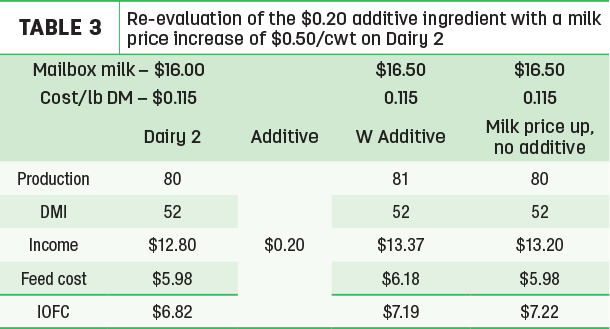
The results look entirely different. We still get the same production response and feed cost change, but now the IOFC has increased from $5.98 to $6.18. We may say, “Gosh, this stuff is amazing.” But again, the results should be considered tentatively. When we look at it, what happened was simply a reflection of the milk price change. If we hadn’t fed the ingredient and our production stayed the same, our IOFC would have gone up to 40 cents due to the income increasing (80 pounds x .1650 = $13.20).
To overcome this challenge to the metric, an indexed IOFC can be used. Select a milk price and use that price to calculate the IOFC regularly. You will still want to do the actual IOFC to know exactly where you are, but the indexed IOFC removes the volatility of milk price. You can then more accurately assess the feeding program and any changes being made. It is a different decision-making tool for a different question.
Dan Hein provides dairy nutrition and management consulting as part of Standard Dairy Consultants (SDC). SDC provides innovative and customized solutions to dairy producers throughout the U.S., with facilities in Idaho, Iowa, Pennsylvania, Texas and Washington.
To download a spreadsheet that facilitates tracking IOFC and an Indexed IOFC on a monthly basis, go to Standard Dairy Consultants.