“Milk Class III futures prices are forecast to decline over 12 percent in the next 3 to 6 months while corn prices hover around $5.85, pointing to another tough year.” The bleak news seems like a reoccurring nightmare: Dairymen and their advisers are looking for tools to increase farm profitability.
Fortunately, sophisticated biological and mathematical models are coming together which more precisely predict animal performance and optimize rations that increase farm profitability.
Evolving tools increase precision, efficiency and farm profitability
Dairy and beef nutrition has evolved tremendously over the last 30 years. If we simply review the last few editions of the Nutrient Requirements of Dairy Cattle, we can see this evolution.
In 1976, TDN and crude protein were discussed; 1989 introduced NEl, DIP and UIP; 2001 introduced MP and amino acids. Along the same timeline, the Cornell Net Carbohydrate and Protein System (CNCPS) was being developed.
Recent iterations of CNCPS have been shown to be highly accurate in predicting milk production and animal growth, with many nutritionists reporting that they can predict within 0.1 lbs of milk per day. Not only is accuracy high, but the ability to formulate with lower levels of crude protein (less than 16 percent) is being done routinely.
The mathematical algorithms used to optimize rations have also been evolving. Traditionally, most formulation was based on linear relationships and minimized diet cost. In other words, a linear system will say “Feed more corn, get more energy, get more milk.” This is true to a point.
But what happens when rumen pH drops and the cow becomes acidotic? To get around this, we typically add another constraint or two. One constraint could be “limit ground corn to 10 lbs per cow,” or “NDF must be greater than 31 percent.” The problem with this approach is that we now know that these relationships are not linear.
Today’s models (such as those based on the CNCPS ver. 6.1) are based on more complex relationships. They model what happens in the rumen. This includes how feeds degrade, what type of rumen microbes grow on them, and the interactions with the cow’s environment. These models are, like the cow, non-linear.
In other words, if we feed 1 lb of ground corn, we will get a predicted response. But if peNDF is low and we feed another pound of ground corn, we will get a different result. Instead of formulating for a set energy level, we are optimizing for energy and protein allowable milk directly; thus the potential interactions with rumen health and different feed quality are included.
Traditional linear optimization of a complex non-linear system is difficult, and at best is an estimate (or guess) of potential performance. In least-cost optimization we define the problem (in this case, solving a diet), set limits (nutrient and feed inclusion minimums and maximums) and let the program find the lowest-cost diet.
The two primary drawbacks to this approach are that the animal biology is more complex and that the lowest-cost ration is not necessarily the most profitable ration.
Finding the ‘sweet spot’ by optimizing income over feed cost
In the June 2010 issue of Progressive Dairyman, Elliot Block discussed calculating and using income over feed cost (IOFC) as a way to evaluate if a feed should be included in a ration or not.
Click here to read the article.
In a Penn State study, Dr. Ken Bailey and Virginia Ishler found that of the profitability measures considered, IOFC was the most reliable measure of future profitability.
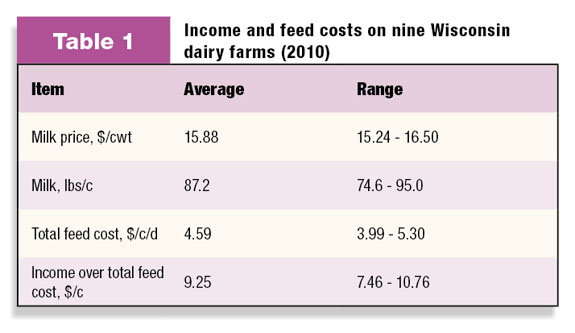
Within a group of nine herds in Fond du Lac County, Wisconsin, IOFC ranged from $7.26 to $10.76 per cow per day. Although the herds had similar resources and business characteristics (average size of 1,356 cows producing 75 to 95 lbs per day), different nutritionists, strategies, and formulation systems resulted in a wide range in milk price, intakes and economic factors. (See Table 1.)
The data show some very interesting points. The herd with the highest income over feed costs had a total daily feed cost of $4.46 and sold 95 lbs of milk. Another herd with 95 lbs of milk shipped had a daily feed cost of $5.30 per cow and 38 cents lower income over feed costs. The herd with the lowest daily feed costs ($3.99) had the third-highest income over feed costs. What does this tell us? Simply put: Neither higher milk production nor lower always result in higher income over feed cost.
To date, very few software developers have offered non-linear models, even fewer offer non-linear optimizers and only a couple have the ability to maximize income over feed costs. Our implementation of the CNCPS non-linear optimizer will minimize feed costs or maximize income over feed costs.
As described in Tylutki et. al. (2010), maximizing IOFC was calculated (and has been observed) to shift IOFC as much as 10 percent over minimizing ration cost. This means 40 to 90 cents per cow more margin, depending on milk price, milk production level, etc., by simply changing an underlying approach.
If you, as a dairyman, are not calculating IOFC today, we urge you to begin tracking this number. Forget least cost or even trying to get that next 5 lbs of milk, if you don’t know your actual IOFC. IOFC is marginal income and there are diminishing returns. The objective is to find that “sweet spot” where you are still capturing additional margin instead of seeing margins decline. In the end, IOFC is what dictates your ability to service debt, run the business and provide for your family. PD
References omitted due to space but are available upon request to editor@progressivedairy.com.
Tylutki is based out of Cortland, New York, and is president of AMTS which focuses on implementing the CNCPS model from Cornell University. He helps develop formulation software, trains nutritionists and provides nutritional technical support and consulting globally.
Tom Tylutki is a research support specialist withAMTS LLC. Email Tom Tylutki.