What if there is more protein in your canola meal or soybean meal than you think? An average high-cow ration is around 50 percent forage and 50 percent commodity feed. As nutritionists, we tend to focus on regularly measuring and understanding forage feed value (nutrient content and digestibility).

However, in many cases, we use book or benchmark feed values for the remaining half of your ration. With commodity feeds (e.g., soybean meal or corn gluten feed), we often assume little variation.
As nutritionists, we usually use tag guarantees for the maximum moisture and crude protein (CP) minimum levels with purchased feedstuffs.
What if there was higher nutritive value than the tag guaranteed? Differences in processing methods (such as milling or drying) or seasonal-regional differences in crop quality lead to different feed values.
What impact could higher nutritive value have on your purchased feed costs? Working with your nutrition consultant on better knowing your commodity feed quality may save thousands of dollars on your feed bill.
Commodity feed quality variation is not a new topic
Missouri researchers measured feed variability within production plants (where variation should be minimized compared to across plants) in the 1980s.
Their group found that using byproduct feed book values in rations was risky for nutritional performance and suggested we should test these feeds.
California researchers and consultants have done considerable work showing variation in feed value for a variety of commodity feedstuffs.
University of California – Davis researchers evaluated more than 50 byproduct samples in California and found substantial variability. The authors indicated that processing and handling impacted byproduct feed quality variation.
The same group continued its efforts and found differences in digestibilities for nine different byproduct feeds collected from three different sources in California.
Later, other California researchers and consultant groups assessed larger feedstuff sets used in California rations (17 feeds in one study and 12 feeds in the second).
These groups found less variability when the feedstuff came from a sole supplier but noticed that commodity feed quality differed from book values.
More recently, and possibly a very important finding, researchers measured concentrate feed variability within 50 commercial dairy farms across the U.S.
The researchers found neutral-detergent fiber (NDF) varied nearly as much as forage NDF.
The changes were large enough to impact dairy performance if not accounted for.
A recent summary of several feeds in our database confirms commodity variation.
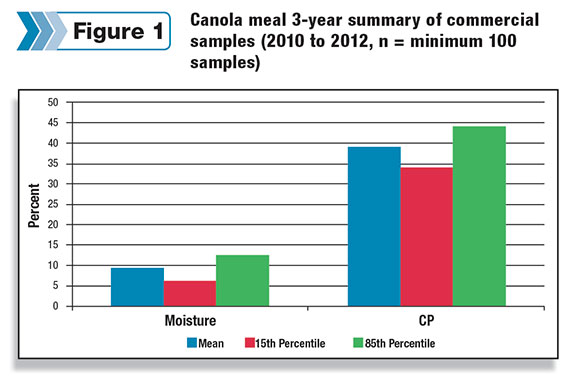
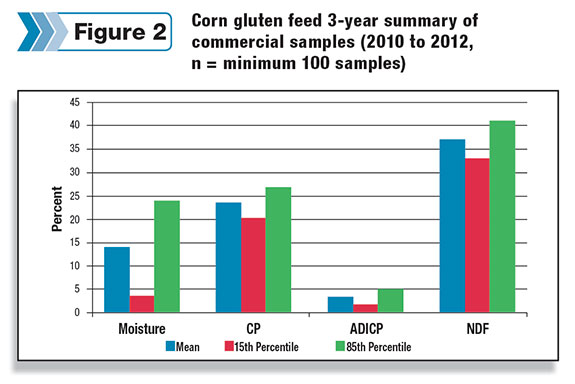
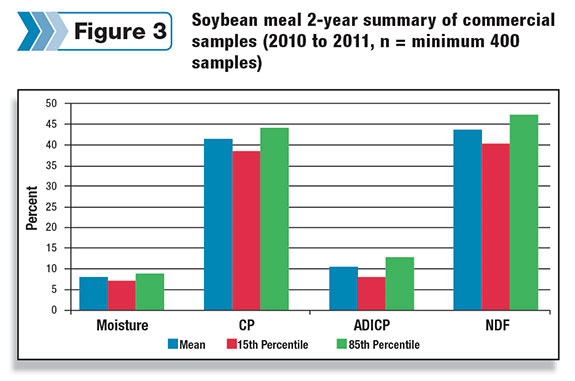
Figures 1, 2 and 3 are three years’ summaries for several commodity feedstuffs we’ve analyzed through our lab.
All values listed, except moisture, are listed on a DM basis.
In addition to the summary shown here, we have recently documented and published preliminary work with Midwestern commodity feeds’ variability.
Digestibility varies as much or more as nutrient content, and we can speculate differences in processing techniques and drying are changing the protein and energy characteristics.
Real-world ration and cost impact
Here is an example of the impact variation in protein had for one of my former colleagues, Dr. Neil Michael (Arm & Hammer Animal Nutrition, senior business manager), while consulting with a commercial dairy during the past few months.
They began (October 2012), looking for ideas to cope with rising feed costs on multiple dairies throughout the Midwest.
One of the first actions taken was to analyze TMR samples to compare to formulated values. Lab analysis consistently revealed ration CP in excess of 0.6 percent of ration-formulated CP on a DM basis.
The dairyman stated, “We were fairly confident of our on-farm forage testing program (hay and corn silage) but were relying on book values for our canola meal and other byproducts.” Subsequently, the next several loads of canola were submitted for nutrient analysis.
Surprisingly, the lab samples showed CP levels in excess of formulation book values from 3.5 to 4.5 percent, after which new rations were formulated using 4 percent higher CP values (on a DM basis). Follow-up TMR analysis validated CP levels delivered were nearly identical to formulated values.
As a result, canola costs were reduced by more than five cents per lactating cow per day, or over $2,700, for the decision to more closely evaluate this single byproduct.
From this experience, the dairy managers routinely sample other commodities on a regular basis to ensure the entire ration is evaluated to optimize performance and profitability. PD
Goeser earned a Ph.D. in animal nutrition from the University of Wisconsin – Madison and directs animal nutrition, research and innovation efforts at Rock River Lab Inc. based in Watertown, Wisconsin.
References omitted due to space but are available upon request. Click here to email an editor.

John Goeser
Director of Nutrition, Research and Innovation
Rock River Laboratory Inc.