Twenty billion dollars. We feed $20 billion of feed to dairy cattle in the U.S. every year. We have highly sophisticated programs that can tell to the milligram how much iodine should be fed.

Over the last 10 years, we have begun to measure pounds of feed being delivered to groups of dairy cattle and, in rare cases, how much feed is left. What there hasn’t been is a comprehensive system of quality assurance for our feed system. Let’s call it TMR quality assurance.
Most dairymen understand milk quality assurance. The first step is to avoid major errors (i.e., antibiotics in the tank). The next step is to improve milk quality (lower SCC) through better milking procedures and equipment maintenance. Eventually, concepts like parlor throughput and pounds of milk produced per milking stall are explored. Information systems have been in place to collect critical data to make sound decisions.
For our feed systems, we are just at the beginning. New software is doing a pretty good job at measuring pounds of feed being delivered to cattle, which is a start, but how do we measure shrink with these numbers? What’s the best way to prevent shrink?
We know how many pounds are being delivered to the high group, but how do we monitor the quality of the TMR? To move to a comprehensive TMR quality assurance program, we need to begin to identify measurable points in the system. Feed weights can be one measurable point – got it.
What about the nutrient specs of the TMR? How do we control the quality? Traditionally, we have measured forage quality, sometimes the commodities, and then developed a paper ration. We hoped the feeder was mixing correctly, the mixer was working well, and we were good to go.
Let me remind you: $20 billion a year, $2 million for a 1,000-cow dairy. Can you see why crossing our fingers and eyeballing a TMR is not good enough for quality assurance?
Perhaps we can measure nutrient specs on this TMR. I think this is a good starting point for discussion and has been underutilized on farms. But this needs to be much more than one random sample per month.
We can first pull multiple samples of the TMR as the TMR is delivered. Statistics may indicate pulling five samples, but I like 10 samples. It gives you a nice visual graph – statistics are useless if they can’t be communicated – and allows you to see some trends. I’ve been using dry matter, crude protein, macro- and micro-minerals and neutral detergent fiber (NDF). Looking at these results across 10 samples gives a very nice view into what’s happening at the dairy.
What am I looking for?
First of all, I’m going to ask whether the average of the 10 samples matches the paper diet. In the past when I have taken one TMR sample (even if it was a composite sample and I sampled carefully), it was easy for a producer, feeder or nutritionist to ignore this one sample by implying I must have sampled incorrectly and we need to take these results “with a grain of salt.”
Ten samples are a bit harder to ignore. If the average is wrong, what happened? Of course, the most obvious checkpoint is the dry matter of forages, but if the NDF and dry matter are about right and crude protein is 18.5 percent (versus the expected 16.5 percent), it’s time to go back and re-test feeds.
But to me, while re-testing is fine and a smart thing to do, I want to know why procedures were not in place to prevent this issue. Is there a rolling average on commodity quality from each supplier? How are loads of commodities screened coming in? How do we prevent this inconsistency in the future?
Second, what is the trend on each nutrient? Let’s look at a couple of examples. Figure 1 shows that as the feed was delivered, the protein increased across the samples. This particular dairy fed this TMR across three pens. The first pen had a diet with 16 percent crude protein, the second was 17 percent, and the third was 18 percent, resulting in essentially three diets when one was desired.
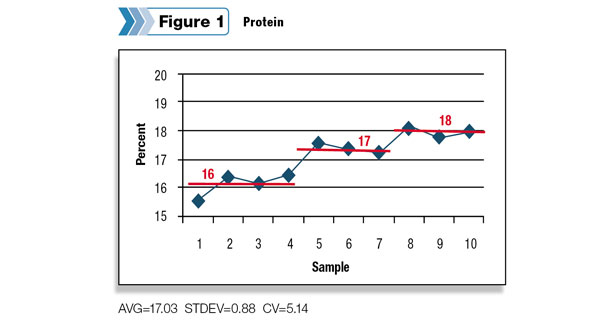
I like to combine data with some practical eyeball observations and a video of the TMR mixing process. In this particular case, the likely issue was protein being added to one end of a dual-screw mixer. (Why the video camera? Video evidence is more difficult to dispute than an overweight nutritionist with some pretty graphs.)
In Figure 2 , at a different farm, the zinc is much higher in the first half of the load than the second half. It would be easy to argue that even the lower zinc level is sufficient. But I look at the zinc (and copper and manganese) as markers for the micro-premix and special additives. This particular TMR was being fed to post-fresh cows.
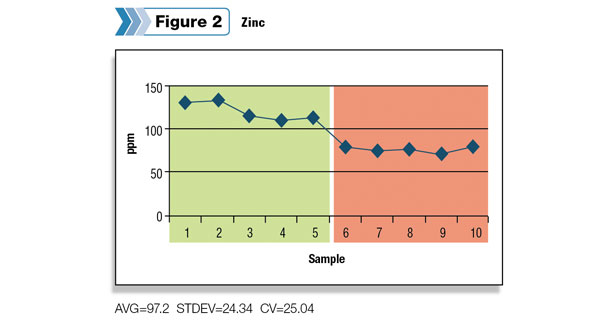
All the additives (think methionine, Rumensin, etc.) were being overfed on the first half of the TMR and underfed on the second. This is a real concern for this group. If the cows eat in the same spot every day, they are being underfed or overfed specific nutrients. If they move to a different spot each day, their diet is continually changing.
What about sampling variation and lab variation? There are a few good procedures on sampling TMRs (search Google for “Robinson TMR sampling”) and when samples are all sent to one lab, results match what I see on the farm.
Sending samples to multiple labs is where it gets tricky. Recently, I carefully took one sample and split it five ways. These five samples were sent to five well-known, commercial labs with a request for analysis ( Table 1 ). When I received the results, no lab indicated on the PDF report whether NIR or wet-lab procedures were used. Although a quick call to each lab cleared up the questions, you can’t assume what method is being used on TMRs.
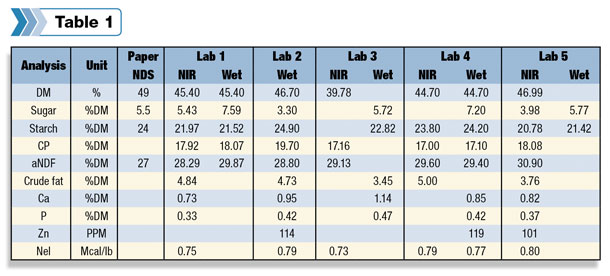
The dry matter and NDF values were fairly consistent across labs (except for one dry matter). Other nutrients were less consistent. For sugar, one lab has switched to water-soluble carbohydrates while others are still using ethanol-soluble carbohydrates; however, this did not account for large differences between labs using similar procedures.
How do we use these labs with this type of variation? Be clear with your lab on what procedures you want to use. Do the results coming back make sense? My experience with two key labs is that they are very consistent within the lab.
That makes comparison for quality assurance OK across 10 samples. But if the 10 samples do not match your paper ration, ask the tough questions: Can we split samples and send to different labs? Should I blindly send two identical samples to a lab?
We have a long way to go on feeding systems on the farm. Statistical quality control has been in place since the 1930s in manufacturing. Feed mills utilize modified systems. Sampling TMRs in a systematic fashion is just one small step in TMR quality assurance. Take the baby step, and then take the next step. PD
Paul Dyk is a dairy technical service manager with Quality Liquid Feeds. He can be contacted by email .

-
Paul Dyk
- Dairy Technical Service Manager
- Quality Liquid Feeds
- Email Paul Dyk