You remember the bell curve – a common distribution of values. If you’re taking a poll, you chart the responses and the resulting chart resembles a bell shape with most responses falling within the “middle ground” or “top” of the bell. The bell creates down-sloped curves at either end of the continuum where extreme responses fall, representing the less common values or deviations.

Let’s say we’re evaluating customer service, for example. Most people fall in the “pretty good” customer service bulge, or top of the bell. They’re fairly polite to customers and try to be helpful. And then there are those few, like the people who created the “if you speak English, press one now” system, which rank more than two standard deviations below normal and should be shot on sight (and I hope you let them know that every chance you get). They fall way down on the extreme lip of the curve.
Your cow has curves – a lactation/gestation curve, a dry matter intake (DMI) curve and a body weight curve. While these charted curves don’t follow a typical bell-curve pattern, familiarizing yourself with each curve will help you determine how to feed the cows based on what’s happening.
Gestation/lactation curve
First let’s chart the gestation/lactation curve and see where that takes us.
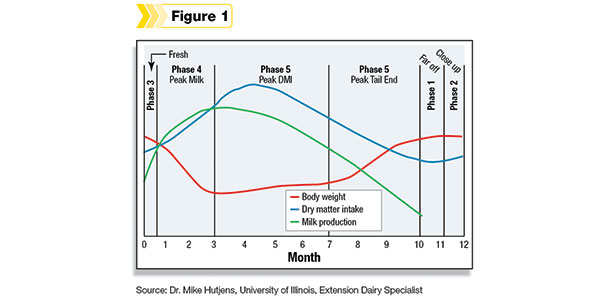
Phase 1: On the upswing side of the curve near the bottom (see Figure 1), is the beginning of the dry period, sometimes referred to as the far-off dry cow, or some refer to it as the traditional dry cow program. If you want to manage post-calving lactation, you’ll manage this pre-calving phase closely as it will directly impact post-calving milk production. It typically includes the period 40 to 45 days following dry-off.
Phase 2: This is the close-up dry cow – roughly 21 days before calving. Many feed companies and nutritionists are encouraging dairymen to split the cows in this group from the Phase 1 cows so that different nutritional issues can be addressed.
Phase 3: This is the fresh cow phase – from 0 to 14 days post-calving. Unfortunately, this window varies among dairymen from as little as 7 days to as long as 28 days. This is the time when the cow moves into lactation but before peak milk production is achieved.
The critical time period for managing the full milk production cycle of the cow, then, is 21 days prior to calving through 21 days post-calving.
Phase 4: Phase 4 is from 14 to 80 days post-calving (and will vary on some farms to be 100 to 120 days). This is when peak milk is being achieved, DMI is building and body weight loss is occurring.
Phase 5: This is from 80 to 200 days in milk. During this period, peak DMI will occur, as cows are pretty much producing what they’re consuming.
Phase 6: The final phase puts us on the backside of the curve where the cow is pregnant, gaining weight and headed into the dry-off period again. This occurs from 200 to 330 days into lactation. With bST technology, this phase is almost eliminated. These cows typically gain body weight under a non-stressed condition.
Milk production curve
The milk production curve (see the white line in Figure 1) we’ve already talked about. No surprises there – peak milk comes in around 40 to 70 days after calving (during Phase 4). Then it drops off at a predictable level on the backside of the curve. Peak milk, for our purposes, is defined strictly in terms of volume, not fat corrected, as some cows have very high butterfat tests in the first two or three weeks after calving. And it should be noted that a first-lactation cow will have a flatter peak than older cows, or produce about 77 percent of what an older cow will produce, as the younger cow will still need to use some of her energy for growing.
Dry matter intake curve
The dry matter intake curve (see Figure 1) shows that cows actually hit peak milk production before they hit peak DMI. Some time after peak milk is reached is when the most groceries are consumed. Then, predictably, when the cows reach the late lactation and dry-off period (Phase 6 and Phase 1), DMI also decreases as gestation progresses.
Body weight loss curve
Now look at the body weight loss curve (see Figure 1). Just when you thought you had curves figured out and they were predictable and you weren’t learning anything new, this curve inverts. There’s a rather dramatic decrease in body weight while peak milk is being achieved. After all, you don’t have the grocery intake peaked yet, and the energy has to come from somewhere – so the cow takes it from body conditioning. It levels out but doesn’t begin to gain ground again until late lactation or heading into the dry-off period. It’s important that the cow gain weight back before going into Phase 1.
Using the curves
With an understanding of these curve dynamics, a nutritionist, producer or veterinarian can use different strategies with types of feed, types of nutrients, amounts of fats or amounts of by-pass protein to build rations that compliment the curves and optimize cow health, performance and reproduction while maintaining feed costs.
If you use the “200 rule” to estimate total production in a lactation cycle, you’d take actual peak milk and multiply it by 200. (Some individuals use the 250 rule for peak milk measured on DHI.) Let’s use a Brown Swiss example, where the cow is giving 90-pounds milk at peak lactation. If we multiply that by 200, we would expect 18,000 pounds of milk if she follows the typical lactation curve. If she actually produces more or less, then we can start interpreting what went wrong. Did she beat the curve and produce more (indicating something happened in early lactation)? Or did she produce less (indicating a problem during mid to late lactation)? Where did her curve go wrong?
Another way to analyze the data is to follow the curve of each cow, or even a group of cows. First-lactation heifers are expected to produce 75 percent of the volume of older cows – because remember they have a smaller body size and smaller intake volume. If your first-lactation pen came in at 80 percent, that looks exciting on the surface. However, caution must be exercised when comparing groups. It could mean the heifers are superstars, but it could conversely mean your older cows are breaking down or have health issues.
Producers don’t have trouble ramping up the peak milk cycle and knowing what to expect on the top of the lactation curve, but what should the backside of the curve look like? Some data indicates that first-lactation cows typically drop about 6 percent production a month. Older cows, however, peaked about 25 percent higher volume, so their lactation curve dropped about 9 percent a month after peak milk was achieved. If you find the lactation curve flattening or dropping off too steeply, it’s possible to make some corrections by identifying the corresponding issues and building a ration specific to those needs.
Several things can affect the lactation curve – reproductive problems, by-pass protein changes in the ration, using bST – but the curve itself becomes useful in bringing attention to changes in the herd. Consider these advantages:
- Instead of just looking at the rolling herd average, the lactation curve can provide another way to look at current production in the bulk tank and assess what may be happening in the herd.
- We can look at lactation curves in the first, second and third phases and ask if it looks normal or detect a deviation.
- When cows in first-lactation pens are evaluated on a curve we can get an idea where the future herd will be in a few years. Are they going to be better than the older cows? Can we find some weak links?
- We can watch the peak changes and match those up to ration changes, in terms of a nutritional change. By evaluating the phases, six feeding phases or rations can be developed.
- A change in the curve might also indicate an environmental change, and we can then determine whether the change was right or wrong, helpful or regressive.
Interestingly, as you pay your feed bills, manage your milking crew and fix your silage chopper for the fourth time this year, your actual blood-pressure curve may exactly mimic the lactation curve. We should do a study on that … but we’re not discussing your curves. That’s another issue altogether, and I have no idea how to adjust your feed intake to help your blood pressure. Good luck with that one. PD
To see feeding strategies for each lactation phase, see "Peak milk, intake and body weight: How curvy is your cow? Part Two."