
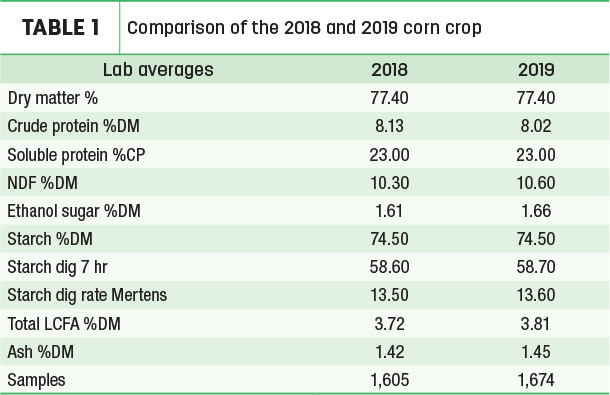
Based on over 1,600 samples from a commercial feed lab, the crude protein (CP), soluble protein, neutral detergent fiber (NDF), sugar, starch, starch digestibility, starch digestion rates, total fatty acids and ash content are all very similar (Table 1).
This surprised me, as I had talked to feed mills and grain elevators across the country and kept hearing stories of bushel test weights from a low of 48 pounds per bushel to a high of 60 pounds per bushel depending if the corn was harvested late or on time.
The foreign matter (FM) has also been crazy in this 2019 harvest, with extra junk being brought in from the fields to the grain elevators and feed mills. Rain interfered with getting adequate weed control in cornfields early, which added to the high FM and, in some cases, goofy fatty acid profiles coming back in corn silage samples from excessive amounts of weed seeds. Inconsistent drydown and variable kernel sizes also hurt combine performance when cleaning the corn from the cob and resulted in higher FM than normal.
These feed mills and grain elevators reluctantly admitted that the average bushel weight is very similar to last year’s crop, but the variation they are seeing is much greater. This led me to look at the lab test variation in standard deviations. The lab results were just as variable as what the feed mills and grain elevators were reporting (Table 2).
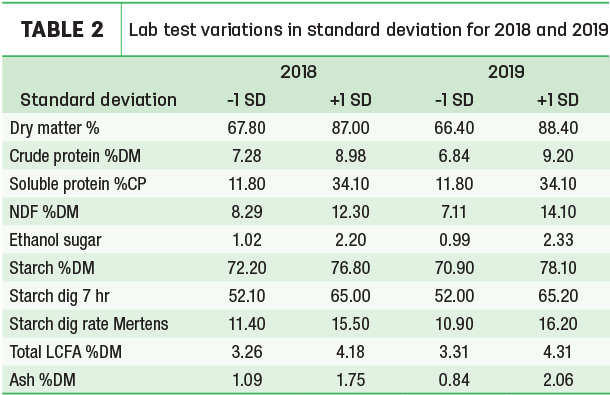
As you can see from Table 2, some nutrients have a much greater variation this year than in 2018. The 2019 crude protein, while the average is very similar, has a larger variation (plus or minus 2.36%) than it did in 2018 (plus or minus 1.7%). This is a jump in CP of 0.66% variation within one standard deviation.
What does this mean for you on the farm? Last year, your corn averaged between 7.28% and 8.98% CP about 67% of the time (pardon me for abusing statistics here), and if you are feeding 8.5 pounds of corn dry matter, your bulk tank varied about half a pound of milk per cow per day with these protein fluctuations from load to load of corn in 2018. This year, it is a bit more than three-quarters of a pound of milk per cow per day fluctuation from load to load.
I know on most of my farms we cannot see this small variation, but if you factor this in with the ranges in starch digestion rates, you could see as much as 3 pounds of milk variation from load to load differences in corn quality.
What’s the answer? Simple: Test more frequently. Most of the industry will test corn in the fall of the year and use those values long term or, worse, use the standard shelled corn values in their feed library, which is often an outdated definition with its 9.25% CP and 72% starch content. Testing monthly this year may well reward you with more consistent milk production and better components.
Variation in starch digestion is where the really large difference shows. Again, the average starch content, seven-hour digestibility and digestion rates are all very similar. But the variation in these nutrients is much greater in the 2019 crop than in the 2018 crop, and this changes how we look at the 2019 crop. This is not unexpected with the late planting, immature corn harvested and delayed harvest adding to this variability in the 2019 corn crop.
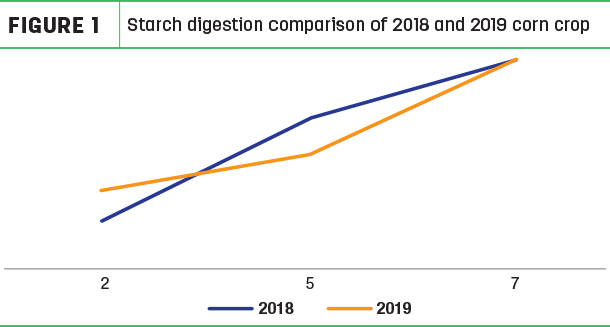
Most producers are down slightly on milk but have some of the best components ever. We have several 2019 gas in vitro samples back suggesting that the two-hour digestion rate is very high, but the five-hour time point is much lower than expected based on the two-hour point being so high. Think of it as exploding out of the start gate but then lollygagging around for the next couple of hours before speeding up and catching the 2018 seven-hour timepoint (Figure 1).
So from three to six hours (approximately), there is poor starch digestion in the rumen, lowering overall microbial production, which lowers milk. At the same time, less lactic acid is produced. This helps to keep the rumen pH less acidotic, which favors the fiber-digesting bacteria that ferment fiber into more acetic acid, helping to raise component levels even higher. Bottom line: less milk but higher components.
Looking at most of the corn ears in 2019, this makes some sense. We see the bottom half to two-thirds of the ear to be full of large, mature kernels that would follow a slower starch digestion rate curve. But at the top end of the ear, we find smaller kernels that are very immature and would have a very fast starch digestion.
Ironically, there are not many in-between kernels, so we have a third of the ear with very fast starch digestion and two-thirds of the ear with very slow starch digestion. This also matches with what we see in the cow. Adding a fast starch source has done little to increase milk production, and increasing total starch also has had little positive impact and, in some cases, has been a negative.
We have seen good results with adding some of the mid-protein and mid-starch byproducts such as corn gluten feed and wheat midds. This has filled those middle starch digestion doldrums that we are seeing with the 2019 corn crop and has generated some nice increases in milk production.
The 2019 corn crop certainly has added more challenges on the farm. More frequent corn testing will help ensure a balanced, cost-effective ration is being fed more often, resulting in greater nutritional consistency that should increase overall profitability. Just what challenges will the next harvest season bring us? ![]()
PHOTO: Lynn Jaynes.
Steve Massie is head of nutrition for Renaissance Nutrition Inc. Email Steve Massie.