Feed efficiency has gained a lot of attention recently due to the grain market’s volatility. When corn was more than $7 per bushel and soybeans over $12 per bushel, this forced producers and nutritionists to examine ways to improve profit margins.

Producers also started monitoring income over feed costs as a means to track profitability. Both numbers have value regarding when to take advantage of the good times and how to manage risk during the bad times as reflected by milk prices and feed costs.
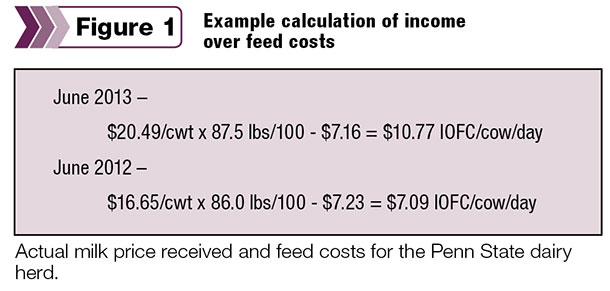
For lactating dairy cows, feed efficiency equals energy-corrected milk divided by dry matter intake. Income over feed costs (IOFC) is calculated by taking the all-milk price per hundredweight (cwt) times the daily average milk production divided by 100 minus the daily feed cost per cow. Figure 1 shows an example calculation of IOFC.
The Penn State Extension Dairy Team developed an Excel spreadsheet that easily calculates IOFC. The user enters in their ration, either on a per-cow-per-day basis or by batch weights fed to each group. It is tied directly to the Penn State Feed Price List.
The user selects the month that is reflective of the ration, and all the home-raised feeds are populated with that monthâs market prices. The user enters in the purchased feed and their respective prices.
Once the feed cost per cow per day is calculated, the user enters in the amount of milk shipped for the month and the gross milk price per cwt to calculate IOFC.
The information can be graphed monthly to monitor how the herd is performing. Penn State reports their IOFC on a monthly basis along with a graph of multiple years that other producers can check against for comparison.
In addition to the Excel spreadsheet, the mobile app DairyCentsPro was developed by extension specialists at Penn State to tie together a producerâs IOFC as well as several feed management metrics.
Dry matter intake efficiency or feed efficiency can be monitored and graphed over time for the entire herd or for various groups. It can be downloaded through iTunes and is available for Android devices through the Google Play Store. Visit the DairyCents Mobile App webpage for more information.
It should not be assumed that a high feed efficiency correlates with improved IOFC. Table 1 illustrates this point using a research study conducted at Penn State University in 2006 that compared the nutrient efficiencies for rations based on either alfalfa or grass silage.
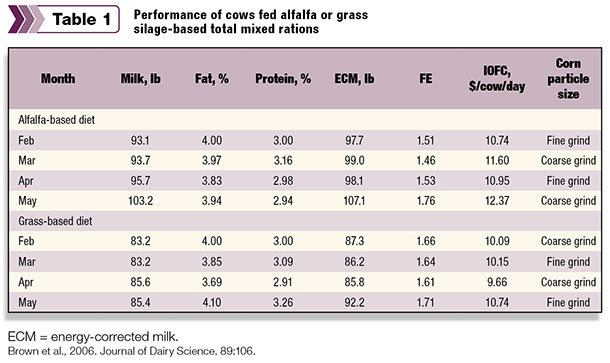
Each month the particle size of the corn grain was switched between coarsely ground and finely ground. All other parameters of the diets remained the same. The grass-based ration had consistently higher feed efficiency compared to the alfalfa-based ration for three out of the four months.
However, the alfalfa-based ration exceeded the grass-based ration in IOFC. The average IOFC for the alfalfa-based diet over the four months was $11.41 per cow compared to the grass-based diet of $10.16 per cow.
The feed efficiency was very respectable on both forage-based diets over the four months considering the rations were fed as a one-group TMR to 60 cows each at 180 days in milk.
The other scenario that can occur when feed efficiency is low (less than 1.3) for the current level of milk production is the potential impact on IOFC. Table 2 illustrates a real-farm situation where feed efficiency was 1.31.
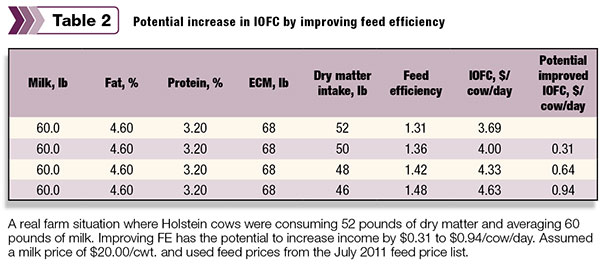
This Holstein herd did not feel there was a problem because of the high components. However, the intake was too high when adjusted for energy-corrected milk. There is an opportunity to improve IOFC if feed efficiency can be improved.
The assumption was made that if the ration could be improved for no other reason but to improve feed efficiency and milk production, and components remained the same, the herd could generate an additional income of $0.94 per cow per day. If forage quality is poor, then there may be limits to what is feasible to bring intakes into line.
Improvements in feed efficiency could be achieved if the energy density of the diet were increased, most likely by utilizing purchased supplements. Monitoring IOFC along with feed efficiency is a good strategy to ensure that income is not being sacrificed for improved feed efficiency.
In the Penn State dairy herd, feed efficiency and IOFC are monitored monthly. Table 3 shows how feed efficiency and IOFC compare to other herd metrics for 2009 through 2013. The herd is on a relatively high forage-based diet consisting of corn silage, alfalfa silage, cottonseed hulls and grass hay.
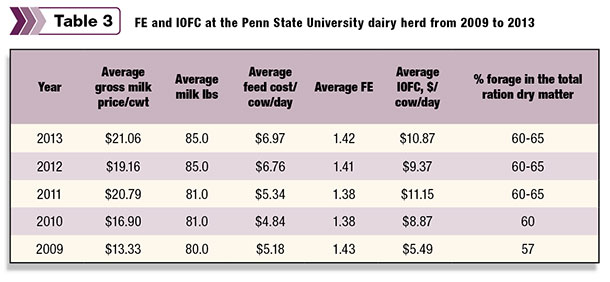
The concentrate consists of corn grain, candy meal, liquid sugar, roasted soybeans, canola meal, Optigen and a generic mineral vitamin mix. The mature cowsâ average bodyweight is 1,450 pounds.
Examining the five-year average for feed efficiency, the months of May and January consistently have the highest feed efficiency at 1.44, and the months of September and October have the lowest at 1.36 feed efficiency. The other months are very consistent at 1.41 feed efficiency.
Using feed efficiency and IOFC together as a tool can be very effective in detecting if there are missed opportunities for improving animal performance or profitability.
Both are relatively easy to calculate and monitor over time; however, they should never be the only information used when making decisions. They are adequate at illustrating if there are potential problems and if further investigation is warranted. PD

-
Virginia Ishler
- Nutrient Management Specialist and PSU Dairy Complex Manager
- Penn State University
- Email Virginia Ishler