Corn silage and grain yields have steadily increased since World War II (Figure 1) with a slightly greater increase per year for corn grain than for corn silage, possibly reflecting an emphasis on corn grain improvement by plant breeders in the past decades.
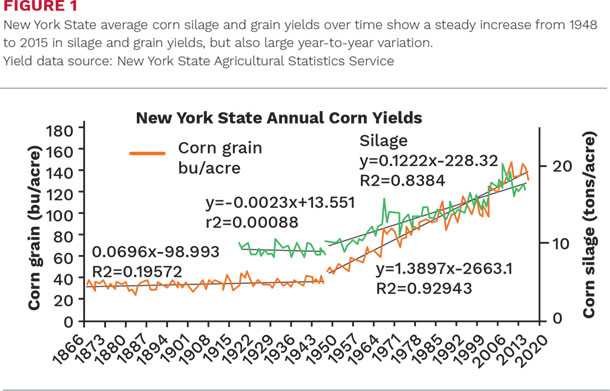
With an increase in yield comes the question: Has the ability of improved crop varieties to explore the soil for nutrients kept up with higher yield or do we need to supply more N fertilizer to meet N needs? Further, we need to look at what differences in field traits (within and between fields) affect yield beyond the hybrid selected and the N fertilizer or manure that was applied.
Nationwide evaluation of N use shows that overall farmers are using the same average fertilizer N rates, even while yields have been increasing. How are we doing in silage production areas such as New York State?
Before we can answer these questions, we need to know the actual yield levels for corn grown for grain and corn grown and harvested for silage. We also need to know how stable yields are from year to year as fields that deliver stable yield results will likely require different management from fields that yield low one year and high the next, depending on the growing season.
With a growing number of choppers joining the fleet of combines with yield monitors we now have the opportunity to summarize large yield datasets to help update several important issues.
These include the ability to generate an updated general yield potential database, the opportunity for farms to develop and maintain their own yield potential database, and the ability to more quickly test if higher yielding fields, zones within fields, or specific varieties, need higher N applications to meet or exceed potentials.
The first requirement when working with yield monitors is to make sure they are calibrated regularly. However, even with well-calibrated equipment, yield data from monitors will need to be combed for obvious errors through a cleaning process.
An example is shown in Figure 2, where data cleaning changed the reported yield by more than five tons of corn silage per acre. To ensure we use the best possible data, cleaning protocols were developed recently for both grain and silage that now allow for fairly quick checking and cleaning of data for all corn yield data on a farm in a particular harvest year.
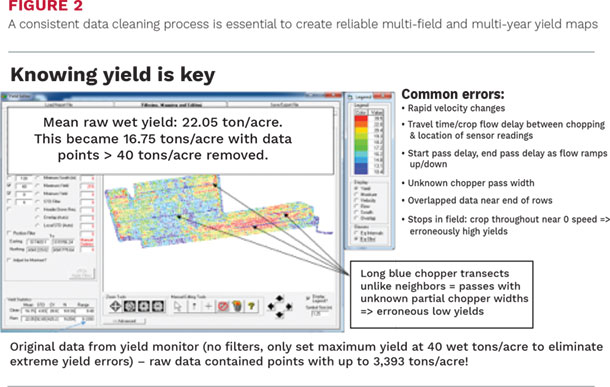
Click here or on the image above to view it at full size in a new window.
A manual that will help producers or consulting companies do this will be released in early 2018. (Cornell University - New yield monitor data cleaning manual).
With this new data cleaning process, the Nutrient Management Spear Program in partnership with farmers and consulting firms, is now analyzing data from test farms located in northern New York through a grant supported by the Northern New York Agriculture Development Program.
The hope is to expand this beyond the farmers currently involved, and thus, over the coming years create a statewide database for corn grain and/or corn silage yields per soil type. Once data are cleaned, we can create yield frequency histograms (Figure 3).
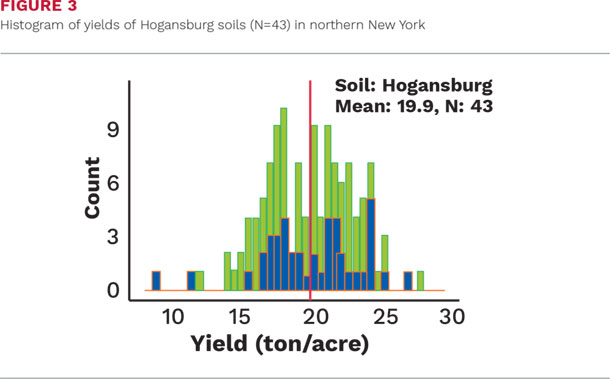
This type of histogram shows the range of yields and how many fields with this soil type provided a certain yield. For example, in the case of the Hogansburg soil shown in Figure 3 (N=43), the average yield was 19.9 tons/acre while five fields out of 43 yielded more than 25 tons/acre and one field averaged 27.5 tons/acre (maximum reported for the example shown in Figure 3).
These histograms allow for determination of means, medians and ranges in yields. They can help us (1) quickly update the yield potential database for corn grain that is the foundation for the basic N guidelines for New York, and (2) develop an independent database of yield potentials for corn grown for silage.
Stay tuned for further updates! A call to participate will be shared with farmers and farm advisors as funding to proceed at a larger scale is granted. The protocols for data sharing are available through the NMSP website (Cornell University - What do NY corn fields really yield). The data-processing protocol will be added to this page once completed.
Acknowledgements
We thank the farmers and farm consultants who participated in the yield potential evaluation project. For questions about these results email Quirine M. Ketterings or 607.255.3061. Visit the Cornell Nutrient Management Spear Program website.
Quirine Ketterings, Tulsi Kharel and Sheryl Swink are with the Cornell Nutrient Managament Spear Program. Karl Czymmek is with the Cornell Nutrient Management Spear Program and Cornell CALS PRO-DAIRY.
This article appeared in PRO-DAIRY’s The Manager in March 2018. To learn more about Cornell CALS PRO-DAIRY program, visit PRO-DAIRY Cornell CALS.