If you are a football fan, you know that a successful year on the gridiron starts with summer training camp. Conditioning your star players and preparing them to hold up for a long season is a must in order to make it to the Super Bowl.

There are a lot of similarities between coaching a football team and managing a herd of cows. Properly preparing a cow for the start of her lactation is key to a productive and profitable lactation.
Such preparation is often described as transition-cow management. It is a fact that herds with good transition-cow management programs achieve higher production and experience fewer health problems.
Our co-operative members can analyze and monitor progress of their transition-cow management program using the fresh-cow summary, which features the patented transition-cow index (TCI), developed by Dr. Ken Nordlund from the University of Wisconsin School of Veterinary Medicine.
TCI values are calculated using the end-of-lactation data gathered from the prior lactation and start-up lactation data (five to 40 days in milk) from the current lactation.
A TCI value of zero basically indicates that the level at which the cow started her lactation is the same as what was projected at the end of her prior lactation.
A positive TCI value means the cow is performing better than what was projected at the end of her prior lactation, while a negative value means she is underperforming. Research has shown that improving TCI by 1,000 points equates to $250 more revenue per cow.
The immediate benefits of a good transition-cow management program are clear; however, does a good or poor transition-cow management program also have a long-term effect on lactation performance?
To answer this question, data from over 250,000 second-lactation and third-lactation records were evaluated.
To determine the long-term relationship between good or poor transition-cow management, TCI values calculated at the start of each lactation were compared to the following four lactation measurements: days to peak, peak milk, lactation ME 305D milk and culling rates.
Cows included in the analysis had to have completed the lactation with at least 150 days in milk.
Cows were grouped in 12 TCI groups (starting at less than -10,000 TCI and going up in 2,000-point TCI increments to more than 10,000 TCI) and two lactation groups (cows transitioning from first to second lactation and cows transitioning from second to third lactation).
Averages for days to peak, peak milk, lactation ME 305D milk and culling rates were calculated for each of the TCI groups.
Results
Before reviewing the results, it is important to understand what TCI values mean. Cows in the TCI groups with negative values are underperforming relative to the expectation generated at the end of their prior lactation. Cows with positive TCI values are exceeding expected performance based on their prior lactation.
Days to peak
Days to peak milk for cows with very low TCI values (less than -10,000) was approximately 73 days, while cows with very high TCI values (more than 10,000) was approximately 30 days. This was the same for second-lactation and third-lactation cows. Cows with a zero TCI value peaked at approximately 53 days in milk.
Peak milk
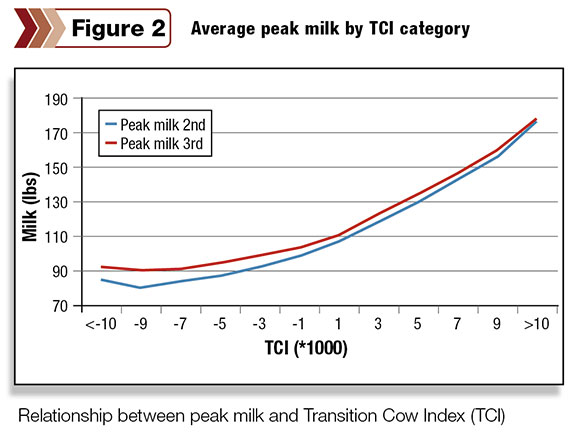
Figure 2 shows the impact of both poor and excellent transition-cow management on peak milk.
Cows with very low TCI values, (i.e. cows with transition problems) only averaged 90 pounds for third lactation and 86 pounds for second lactation, while cows with very high TCI values averaged peak milk yields of 177 pounds of milk.
ME milk
Figure 3 shows the ME milk for second-lactation cows (blue line) calculated at the end
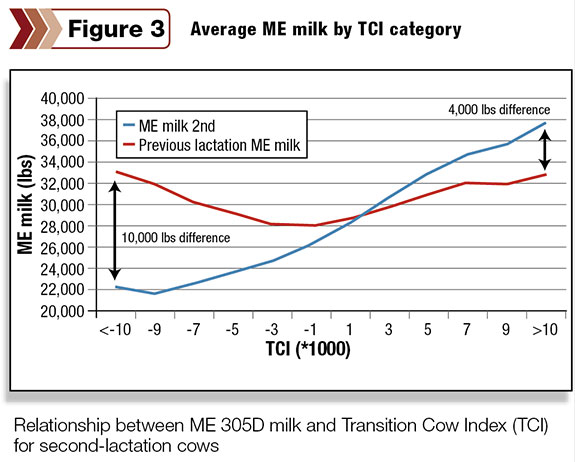
of their second lactation and the ME milk production for their prior lactation.
Following the same trend as peak milk, cows with poor TCI values experienced much lower ME milk values (blue line) than cows with high TCI values.
One could make the argument that if a cow is a poor performer in her prior lactation, she probably would be a poor performer in her next lactation and as a result have a low TCI value.
To analyze if this is true, the current-lactation ME milk production for second-lactation cows was compared against their prior-lactation ME Milk production.
From Figure 2 you can determine that cows that had poor TCI values and low ME milk when transitioning from the first to the second lactation had excellent production levels in the prior lactation (red line); therefore the argument that cows with poor TCI values were poor performers in their prior lactation does not hold true.
Cows with excellent production in their first lactation faced with a very poor transition produced 10,000 pounds of milk less in their second lactation. As TCI values increased, this difference becomes smaller; second-lactation cows with very high TCI values showed improved performance of 4,000 more pounds over their first lactation.
Culling
Cows included in the overall analysis had to have completed 150 days in the lactation, and cows sold for dairy purposes were excluded from the culling analysis.
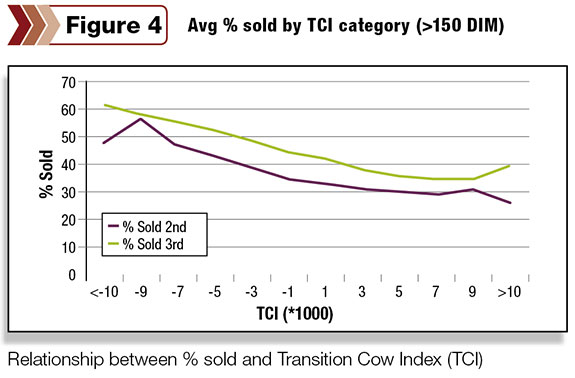
Figure 4 shows that culling rates for second-lactation and third-lactation cows with low TCI values were much higher than cows with high TCI values.
Cows stayed in the herd for over 150 days in milk before being sold.
Almost half of the second-lactation cows with very low TCI values were sold prior to the end of their second lactation.
This rate was even higher on third-lactation cows, of which nearly 60 percent were sold.
Conclusions
TCI provides a good tool to measure transition-cow management. The impact of a poor transition-cow management program can last long past the start of lactation.
In general, cows with a poor transition will see longer days to peak, lower peak milk, lower lactation production and higher culling rates compared to cows with excellent transition.
To put this in perspective, in 2012 the difference between the 20th and 80th percentile TCI values for our co-operativeâs Holstein herds was 1,413 TCI points.
This translates to a difference of $353 per cow. Monitoring your transition-cow management program and evaluating the changes you make will provide a significant short-term and long-term payback. PD
Fourdraine holds a Ph.D. in animal science from Texas A&M.

Robert Fourdraine
Vice President of DHI Operations
AgSource Cooperative Services


