The national morning news reports the NBA scores from the night before and the weather for the day. “Last night in the NBA the score was 1904. Half of the teams won with average scores of 98 to 92. "Meanwhile today’s weather will average 50 degrees across the country and there will be clouds and sunshine at least somewhere.” So did your team win? Is this a day for the Cartwrights or shorts and a T-shirt? If you are in southern Arizona, the latter might work but what about Bayfield County, Wisconsin, or in eastern New York or in the Yakima Valley?

We use numbers to describe what has happened, is happening and will happen all the time. The dairy industry is no exception. Statistics by the thousands track the average sales price of butter to costs of production to total production to production per cow per day to average mailbox prices to more.
Dairy Programs at the USDA and the CDFA both report hundreds of pricing series. There are the hundreds of statistics reported by National Agricultural Statistics Service and Economic Research Service.
Brian Gould of the University of Wisconsin maintains a fairly comprehensive database of dairy-related numbers at Understanding Dairy Markets .
Are these the numbers we need? Some are very useful, such as those on milk production. But do we really need to know what a dairy farmer of 100 years ago living under those standards and milking five cows by hand would need per hundredweight to maintain that third-world existence? (They call that the milk parity price.)
But in the midst of many numbers, a natural tendency is to create a number, The Number, that explains what is really happening. And based upon The Number, policy and other programs kick in and out. And The Number is almost always an average.
Merriam-Webster defines “average” as “a single value (as a mean, mode or median) that summarizes or represents the general significance of a set of unequal values.”
Dairy interests thrive on these averages – average CME cheese price, AMS pricing series for cheese, butter, NFDM and dry whey and the U.S. all-milk price. Because they are mathematically computed and can be proven as to the math, they carry an aura of authenticity and pure information, bringing objectivity to a subjective question such as, “How are things going?”
In this way the U.S. all-milk price in the monthly Agricultural Prices report at the end of each month by NASS can provide some indication of what is happening.
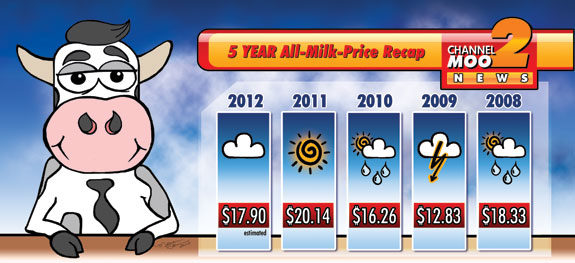
For example, the average all-milk price in 2009 of $12.81 was among the lowest of the decade, and a third lower than the previous two years. While it was unquestionably a disastrous year, does it really tell what happened across the country?
In a world of thousands upon thousands of temperature points, a single average can be used to express climatic changes. But at the location you are, it is meaningless.
It simply is not the case that there is an “average dairyman.” True, all dairymen milk cows and market milk. The similarities end there.
Does the average farmer milk Jerseys, Holsteins or Milking Short Horns? Are the cows milked in a tiestall, a stanchion parlor (Is it herringbone or straight?) or by rotary or by robots? Are they in freestalls, open lot or pasture?
What is their ration? How is the milk used? Where is the farm located? Where does the feed come from? Does the farmer produce all of the feed for the cattle or purchase some or all of it?
Every time the question is asked and answered, the dairymen are sliced into distinct categories, each of which respond differently to the same general conditions of the economy. And each group differs from the average.
In his weekly radio broadcast of “Prairie Home Companion,” Garrison Keilor talks about the goings on at Lake Woebegone, a place, he says, where “all the children are above average,” a comic absurdity that speaks more about the average parent than their children.
George Carlin said it better, “Just think of how stupid the average person is, and then realize half of them are even stupider!” That is the point of average – it is the midpoint on the curve of measurement of things, but not necessarily where the things are.
In the NBA example, the Timberwolves may have scored more than the average winning score but still lost, and the Mavericks may have come up below the average losing score and won.
Averages can mask real problems. In 2001, the USDA was about to institute separate Class III and Class IV butterfat prices. The analysis showed an annual average where the Class III price would always be the mover.
But when individual months were analyzed, Class IV was the mover some of the times and a change of just a few pennies in Class III could result in several dollar swings up and down in Class I prices. In a rare case where the entire dairy industry opposed the rule, the rule was stopped by a court injunction.
Average milk prices may not explain what is happening at the farm level. The all-milk price is a good example. NASS reports a U.S. all-milk price and several dozen state all-milk prices. None of the states are “average.” Looking at the individual states shows differences.
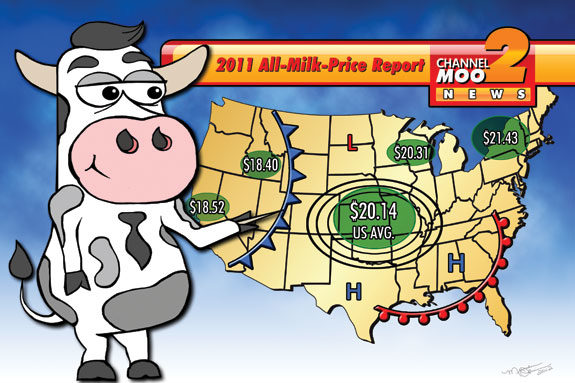
For 2011, the average all-milk price in the U.S. was $20.14 per hundredweight (cwt), with California, Idaho, Wisconsin and New York at $18.52, $18.40, $20.31 and $21.43, respectively. The national average masks the moans of economic pain experienced in California and Idaho.
Looking at costs, this disparity between the average producer and reality widens. According to the USDA, the average alfalfa hay per ton price received in the U.S. for 2011 was $174, but California, Idaho, Wisconsin and New York reported $225.75, $198.08, $109.17 and $132.58, respectively.
Private reports show that producers are paying much more than these prices in the West, but even these U.S.-reported numbers show that differences of costs of production represent even more intense economic stress for dairymen in major milksheds. For example, the real difference between California producers’ gross margin differs from the “average” U.S. producer by another 75 cents or more in just additional cost of hay.
But even the NASS all-milk price for California is not fully representative of the average price in California because it includes base payments. These are, in reality, returns on an asset as opposed to the price of milk. The $17.32 overbase average price in 2011 is over a dollar less than that of the California all-milk price reported by NASS.
In short, a look at the average national all-milk price and costs of feed fail to truly explain the level of pain going on in the West that is not so obvious in the East.
One response is to report a number that combines the milk price and the costs. For years the USDA has reported in its Agricultural Prices report a milk-to-feed ratio. This number divides the all-milk price by the cost of a 16-percent-protein ration of corn, soybeans and alfalfa hay.
The prices for the inputs are those reported as being received by farmers for those commodities for the month. In addition to a national number – December 2011 was 1.81 – the USDA also reports the number for the states of Illinois, Michigan, Minnesota, Missouri, Ohio and Wisconsin. The restriction is because these are the only states in which all of the elements of the formula are reported.
This raises the question: What does a national milk-to-feed ratio mean when prices for corn and soybeans in California, Texas, Idaho, New York, Pennsylvania and New Mexico, to name a few, are not included in the calculation?
At the same time, the industry needs some numbers to describe the situation to a wider audience. Each dairyman knows what his milk price is and what his costs are. He feels the margins.
But in explaining what is happening at the farm level to those in public office, such individual numbers are inadequate to express the general level. The averages we use today also fail in that regard.
As dairy policy and economics continues to be debated, and it will never end, the dairy industry should demand numbers that are meaningful. The emphasis should be on numbers that reflect income, costs and diversity. Rather than a single average, we need a scorecard.
The NBA does not rate itself or its teams on a league average; we do not choose what to wear today on a national average of temperature, nor should we view what is happening in our industry on a single number. It is precision without true information. PD

Ben Yale
Yale Law Office


