Have you ever contemplated benchmarking data for the top 10th percentile of farms and thought, “There is no way I will be able to reach that level” or “I’ve been at that number for years without a lot of effort”?
These numbers can grab your attention, but are these really the type of comparisons herd managers need to engage in at all times?
In this day and age, the dairy industry is so diverse that some farms are hard to compare to each other. Sometimes this variation between farms is seen within a couple of miles down the road.
For example, an organic grazing herd with fewer than 50 milking cows can be a neighbor to a large-scale freestall herd with an automatic milking system. But should we be comparing these farms’ production data just because they are neighbors?
For example, it is common knowledge in the industry that it is not realistic to compare the milk production of Jersey farms to Holstein farms. If these farms were grouped together when making percentile ranks for production, Jersey farms might set unrealistic goals or focus on an area where no major progress can be made.
At the same time, given high milk production, some Holstein farms might get overconfident, and further improvements are hard to be envisioned. This is why most common benchmarking values are reported separately for different breeds.
In addition, most benchmarking values use grouping variables, such as geographic region and sometimes milking frequency or herd size, to make comparison groups updated at regular time intervals.
But just like the breed variable, it has been shown that the cow traffic type used in automatic milking farms (i.e., how cows are restricted in moving between the robot, lying stalls and feeding area) will have a significant effect on milk production. So could benchmarking benefit by differentiating between different traffic types?
There are many other factors that will affect a herd’s production values. How do we take all of these into consideration simultaneously? Are some of these factors more important than others? How could we decide which parameter to use and which ones to leave out?
A recent study published in the Journal of Dairy Science used an improved approach to benchmarking (i.e., cluster analysis) to produce peer groups of farms for comparison. The approach can account for many different variables known to affect how a farm performs, simultaneously.
The identified farm clusters (i.e., peer groups) are groups of farms that are most similar to each other given the most meaningful subset of parameters available from herd management programs. Having a meaningful peer group to compare your farm to is the best way to get valuable information about how you are doing considering your strengths, constraints and the farming environment.
In this study, a cluster analysis was used to develop peer groups of North American robotic milking farms using four years of data collected from farms that have automatic milking systems. Six clusters were identified, and each had unique characteristics that ranged from when they first installed their automatic system and their location to types of facilities.
Briefly, Cluster 1 farms had their automatic milking systems recently installed, Cluster 2 farms were low-producing and Jersey herds with forced traffic systems, Cluster 3 farms were the most northern herds that fed a lot of concentrate due to location (Figure 1), Cluster 4 farms were farms with only one robot per pen, Cluster 5 farms were top-producing Midwestern Holstein herds (Figure 1), and Cluster 6 farms were Canadian farms with relatively low milk quotas.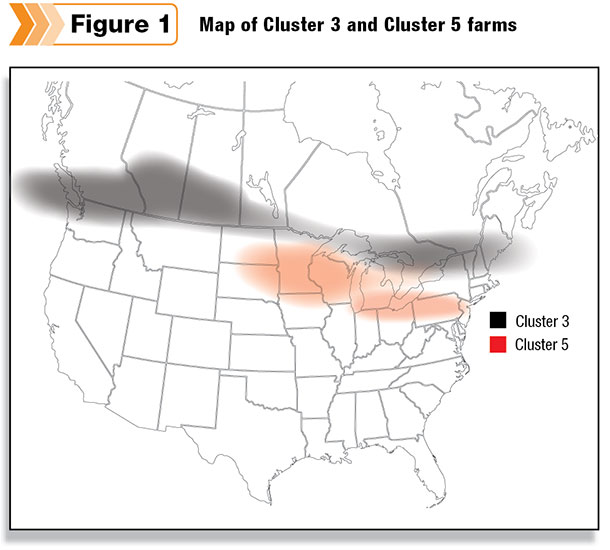
There are two main advantages to benchmarking using farm clusters:
Advantage 1
Clusters’ characteristics lend themselves to customized advice per cluster, for example:
-
Cluster 1 – Farms with recently installed robots need to focus on selecting cows best suited for robotic milking and make sure their robot settings are correctly adjusted for non-Holstein cows.
-
Cluster 2 – These farms should consider changing to a free-cow traffic system. They should also evaluate their feed allowance and robot settings to make sure each cow is allotted sufficient milkings per day and failures are minimized.
-
Cluster 3 – These farms located farthest north could add separate automatic feeding stations outside of the robot so cows can finish their allowance in between milkings.
-
Cluster 4 – Farms with a single robot per pen should identify and remove individual cows that are not a good fit for robotic milking (e.g., a cow that needs to be fetched regularly).
-
Cluster 5 – These top-producing Midwestern farms should focus on making small adjustments (e.g., decreasing failures). In order to continue improving milk production even further, these farms could select cows for high milk speed and cow-robot efficiency.
- Cluster 6 – Because of their limited available quota, decisions should be focused on optimizing the efficiency of milk production with the same number of cows (i.e., getting the same amount of milk while decreasing costs, such as costs of operation, feed and reproduction).
Advantage 2
Comparisons among your peers turn out to be more accurate, for example:
-
Cluster 2 – Since forced traffic type and Jersey cows can be associated with lower milk production, it is intuitive that it is not in their interest to be held to the same standards of what constitutes “high-production” clusters.
For example, a Cluster 2 farm with an average of 66.58 pounds of milk per cow per day would fall in the 32nd percentile when compared to all farms (Table 1).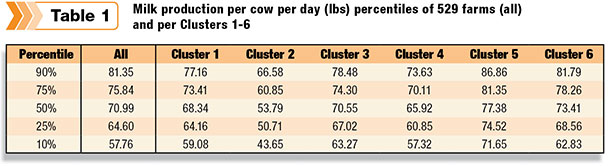 This result could be worrying to the producer, and it could initiate the idea that benchmarking is not the most useful way to compare farms because the individual perception of the producer may be different from what the general benchmarking implies. When compared to only Cluster 2 farms, the same farm is in the 90th percentile (Table 1).
This more realistic comparison allows the producer to switch his or her focus to other aspects of management that could better serve the farm.
-
Cluster 3 – Although increased number of refusals per cow and day is associated with decreased milk production, with so much feed being consumed in the robot in Cluster 3 farms, the robot becomes extra inviting to cows and therefore more refusals will be recorded. A Cluster 3 farm with 1.66 average refusals per cow per day would be in the 50th percentile compared to all farms (Table 2).
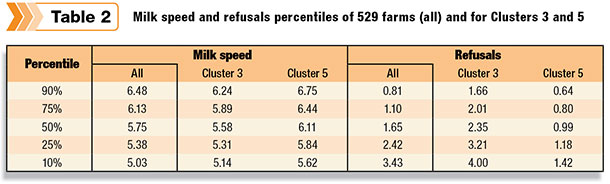 The same farm is in the 90th percentile when compared to only Cluster 3 farms. It becomes clear that the recommendation of the ideal number of refusals needs to be adjusted for Cluster 3 farms because of their cows’ increased motivation to go to the robot.
-
Cluster 5 – The benefit of the cluster analysis is revealed, for example, by a Cluster 5 farm with an average milk speed of 6.48 pounds per minute belonging to the 90th percentile when compared to all farms (Table 2).
This might give an exaggerated sense of achievement. When compared to only Cluster 5 farms, this farm would be part of the 77th percentile, potentially motivating the herd management to set higher goals.
Conclusion
Using cluster analysis to develop peer groups of farms for benchmarking can help the dairy industry accommodate the wide variety of farm characteristics. The cluster analysis approach helps produce customized advice for farms based on the cluster they belong to and helps individual farms set more realistic goals by offering a better peer group for comparison that takes into consideration their strengths and possible limitations.
The current approach opens the way toward flexible time- and space-dependent benchmarking for dairy management by allowing the recruiting of more predictors (e.g., economics, and cattle well-being, health and production).
When individual cow production and genotyping data become widely available in the not-too-far future in the era of “big data,” fine-tuned management decisions at the cow level will become possible. The translation of the results of such data analysis has to reach producers in a way that facilitates customized herd management, not complicate it. PD
Data in this study was obtained from farms using Lely Astronaut milking systems.
Dörte Döpfer, M.Sc., Ph.D., is an associate professor, Department of Food Animal Production Medicine, School of Veterinary Medicine, University of Wisconsin – Madison.
References omitted but are available upon request. Click here to email an editor.


