USDA’s Agricultural Marketing Service calculates and reports U.S. sales of fluid milk products on a monthly basis, using Federal Order and CDFA data to arrive at a total they believe to represent 92 percent of total U.S. sales. They estimate the remaining 8 percent of sales by using population data for areas not included in the two data series.
The AMS reports are considered the best available estimate of total U.S. fluid milk consumption. For the first half of the past two decades, these annual estimates of fluid milk sales have been remarkably steady – the trend line is virtually flat – but they since have tipped slightly downward and, recently, sharply downward.
However, over those two decades the U.S. population grew from 253 million to 309 million, an increase of 22.1 percent. That combination of lower milk sales and growing population means per-capita consumption has fallen by about 25 percent over that time period.
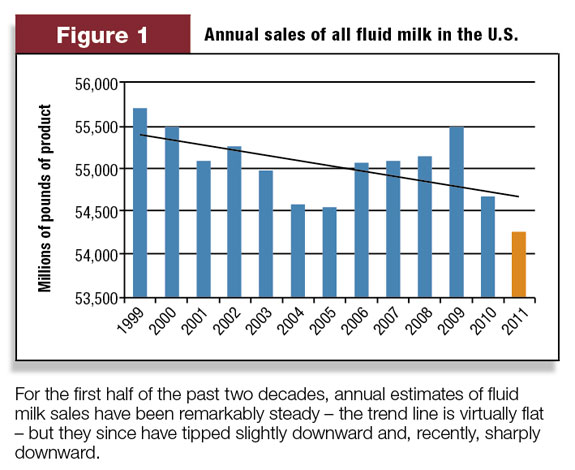
Figure 1 gives a picture of how fluid milk sales have fared over the past 12 years. The indicator for 2011 sales uses actual sales for the first half of the year and assumes sales in the second half of the year will be no lower than they were for the same period in 2010.
However, if sales in 2011’s second half continue to run 1.5 percent lower than the previous year, which they did in the first half, 2011’s fluid milk sales will be well below 54 billion pounds.
The trend line shows the decreasing annual sales, greatly influenced by the results for 2004, 2005, 2010 and 2011’s precipitous drop-off. There were two economic recessions during the period covered by the data – the year 2001 and the 19 months that began in December 2007 and ended in June 2009.
The recovery from the recent recession has been so weak it was recently called “economic purgatory.”
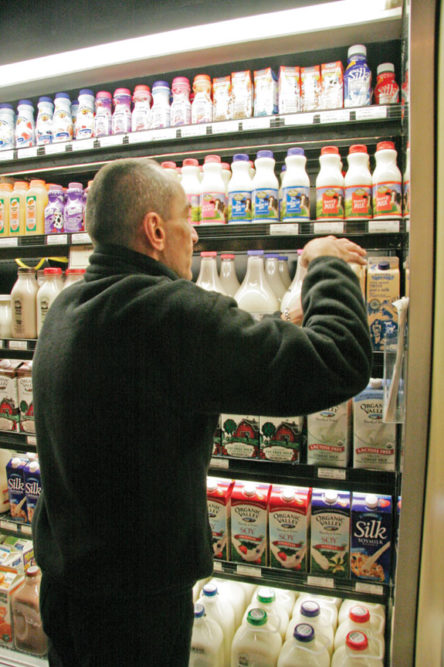
Part of the mystery about total milk sales over the past six years is how well organic milk in California and nationally, which is sold for much higher prices than regular milk, has been faring. The bars on Figure 1 show the combined sales of regular milk and organic milk.
An example of the difference between sales of the two types of milk can be seen by comparing the separate volumes this year of regular milk and organic nationally.
Nationally, organic milk sales increased 19.8 percent while regular milk sales decreased by 2.8 percent; the average of all milks was down by 1.5 percent. Similar divergent sales patterns for the two milks were evident from the time organic sales were first separately reported.
The point here is not that organic milk sales are somehow taking away from sales of regular milk, but to wonder why that is happening, particularly in the present economic climate. Producers generally are not affected because organic milk sales are pooled, but individual processors can be affected in one way or another, even if they do begin to process or carry the additional SKUs.
Historically, studies on fluid milk sales have generally found that consumption has been relatively unresponsive to changes in price levels and economic conditions, but recent results challenge those findings.
Cornell University economists have a model that shows the statistically significant effects of seven demand factors on fluid milk consumption. Their findings have been included in the annual reports to Congress on how the national generic promotional programs have been faring since 1995.
The two factors found to have the greatest effect on per-capita fluid milk consumption are the percentage of the population under 6 years old and the percentage of expenditures on food away from home.
A 1 percent increase in the first is reported to affect per-capita milk consumption by +0.71 percent. A 1 percent increase in money spent on food away from home affects milk consumption by -0.50 percent. Decreases in those factors would have the opposite effect.
Two other factors in the Cornell model are questionable or irrelevant for predicting changes in per-capita consumption of fluid milk. They are changes in average real per-capita income and changes in retail milk prices.
The real per-capita income figure used in the Cornell study is the simple U.S. average, which overlooks the obvious widening differences between the affluent and everyone else.
A stratified measure of real per-capita income would be enlightening, particularly after the report released recently that 46.2 million people in 2010 were below the official poverty level, the highest number in 50 years, and 50 million people are without health insurance.
National median household real income in 2010 fell to levels last seen in 1997, causing a Harvard economics professor to call the period from 2000 to 2010 a “lost decade.”
One might ask how much milk those people are drinking, as well as those in the strata immediately above the poverty level, even though the average real U.S. per-capita income may have risen.
The Cornell model found that a 1 percent increase in retail prices reduces per-capita milk consumption by 0.174 percent. That says, other things being equal, a price increase from $3 per gallon to $4 per gallon should reduce per-capita consumption by about 5.5 percent; it did not, when it happened.
Nor did a decrease from $4 per gallon to $3 per gallon increase per-capita consumption by 4.4 percent, when it happened. The results are mixed.
Figure 1 does show a decrease in milk sales in 2004 when milk prices spiked for a short time – steady sales in 2007 and 2008 when prices reached record highs in the middle of a long, deep recession – then a surge in sales in 2009 when prices fell fast and far, when there were more unemployed, incomes were lower and more meals were consumed at home.
Over the past 10 or so years, it appears consumers have turned away from fluid milk in favor of tap water, bottled water, canned soda and a variety of other beverages. Except for 2004 and 2005, fluid milk sales in 2010 were lower than they have been in the past 10 years, and sales in 2011, realistically, could be a billion pounds lower than last year.
Consumer sentiment is sour. The economic recovery is faltering. Bankruptcies and foreclosures continue almost unabated.
Generally speaking, the best that can be said about the industry’s major generic milk and dairy producer promotion programs is that sales would likely be even lower without them. That is not much of a compliment, and the state and national producer programs appear to be more interested in selling cheese than fluid milk.
DMI’s CEO, Tom Gallagher, recently did put a positive spin on fluid milk sales, saying it is a “growth opportunity” and ticked off a number of successes, mainly with the food service industry. ( Click here to read Gallagher's "3 open minutes" interview in the June 11th issue of Progressive Dairyman . )
But, ironically enough, most of those ideas, and others, for improving milk sales involve higher costs and therefore higher prices for consumers (round plastic bottles and UHT shelf life).
They are working on it, as is the national MilkPep program, whose recent study recommends concentrating on particular usage opportunities and going after one of fluid milk’s fastest-growing competitors – bottled water. Good luck to them all.
Cornell’s key indicator for improvement in fluid milk sales, the percentage of the population under 6 years old, points to the super-important role dairy councils, such as the one in California, play in helping to educate students at an impressionable age about the benefits and pleasure of life-long milk consumption. I know of their good work – may they keep it up.
Addendum: After this report was finalized, the USDA released its estimate for July U.S. fluid milk sales. July sales were down sharply from last July (-4.0 percent for all products, +10.7 percent for organic milk and -4.5 percent for regular milk), which means the conservative projection for 2011 is likely much higher than what will happen.
Instead, look for 2011 fluid milk sales to fall to about 53 billion pounds. That leaves lots of work for our generic promotion programs. PD
References omitted due to space but are available upon request to editor@progressivedairy.com .
—Excerpts from the Milk Producers Council newsletter, Sept. 16, 2011
PHOTO
TOP RIGHT: The point here is not that organic milk sales are somehow taking away from sales of regular milk, but to wonder why that is happening, particularly in the present economic climate. Photo by PD staff.

John Kaczor
Consultant
Milk Producers Council
johndkaczor@aol.com


