
Records can be a huge benefit for all dairy farms in mastitis management. This article will help you understand many of the options (graphs or tables) for examining mastitis data using most dairy management software programs. This is not an exhaustive list of possibilities. Individual farms and consultants may have additional ideas or farm-specific report needs. The National Mastitis Council, Wisconsin Milk Quality, Southeast Quality Milk Initiative and DAIReXNET are among websites with extensive articles on mastitis management.
Before we get started, let us review some basic terminology. First, what is mastitis? Mastitis is an inflammation of the mammary gland, generally caused by microorganisms (primarily bacteria). Mastitis is a costly disease for dairy producers. Economic losses from mastitis result from reduced milk production, discarded milk, drug and veterinary costs, reduced reproductive performance, premature culling, increased incidence of other diseases and loss of premiums paid for maintaining low somatic cell counts (SCC). Somatic cells are mostly white blood cells that the cow’s body uses to prevent and overcome infections. The somatic cell count measures the degree of udder irritation.
Generally speaking, a cutoff of 200,000 cells per milliliter SCC at the cow level is used to classify a cow as having subclinical mastitis. Somatic cell counts are usually reported rounded to the nearest thousandth. For example, a SCC of 200,000 would be reported as 200. Many dairy farms sample cows regularly (often monthly) for SCC through a Dairy Herd Information Association (DHIA) organization. DHIA information is then used to assess levels of and manage subclinical mastitis within a herd. It is important to remember that the numbers reflect the samples collected from cows on that particular milking on test day.
SCC fluctuates considerably among individual cows from milking to milking. New equipment may allow for SCC measurement every milking. Somatic cell counts are also converted to somatic cell scores (SCS). The SCS is a log transformation of the SCC. This transformation is useful because SCS and milk losses are linearly related to SCS. Additionally, SCS can be useful for looking at graphs of SCS without the visual impact of extreme outliers. However, SCC is more intuitive for most people. For this article, most information will be discussed using SCC rather than SCS.
SCC data is used to classify animals according to subclinical mastitis “infection” status. Although these animals may or may not have an infection, this status is based on changes in the animal’s SCC relative to the 200,000-cells-per-milliliter cutoff. An animal with a SCC less than 200,000 is classified as “uninfected.” An animal is classified as having a “new infection” when she has a SCC greater than or equal to 200,000 on a test day, with a SCC less than 200,000 on the previous test day. An animal is classified as having a “chronic infection” when she has two more consecutive days with SCC greater than or equal to 200,000. An animal is classified as a “cure” when she previously had SCC greater than or equal to 200,000, but currently has a SCC less than 200,000.
Mastitis cases are also classified as contagious or environmental. Contagious mastitis is transmitted from cow to cow or quarter to quarter. Most of this transmission occurs in the milking parlor. Contagious mastitis is often chronic and subclinical. Staphylococcus aureus, Streptococcus agalactiae and mycoplasma species are generally categorized as contagious causes of mastitis. Environmental mastitis is contracted from the cow’s environment. Streptococcus uberis, Escherichia coli, klebsiella species, enterobacter species, serratia species, pseudomonas species, bacillus species and prototheca are generally categorized as environmental causes of mastitis.
The following is a list of charts and graphs that can be used to visualize what is going on with mastitis in your herd. Remember to consult with your veterinarian before changing any treatment or vaccination protocols to best target the pathogens responsible for an increased SCC. Lastly, it is important not to overuse or overinterpret SCC data and only focus on mastitis culling and treatment. Prevention of mastitis is always more economical than treatment.
Cautions: In small herds, numbers must be interpreted with caution because of the small number of cows represented in each category. This makes it difficult to determine whether an observation is a herd or individual cow problem. One or two cows can have a huge impact on an average, making something look like a herd trend that really is not.
Graphs and tables using SCC data for subclinical mastitis evaluation
1. SCC by test day
This graph or table depicts SCC trends by test date. This information can be useful for identification of the period when SCC began to increase or decrease (i.e., change in equipment, employees or weather). Additionally, this information can be helpful for identifying seasonal trends in SCC. The period for this graph may be modified to look at trends over a longer period. When a change is observed, questions should be asked about any management, environment or cow changes around the time of the change.
2. Mastitis status by test date
This graph shows trends across time for subclinical mastitis status. Cows are classified as uninfected, chronic infections, new infections or cures. Ideally, more than 85% of cows are in the uninfected category each test. This graph can be used to identify trends or changes in the distribution of animals among these four categories.
3. Percent of the herd with SCC greater than 200,000 by test date
This graph depicts changes in SCC across time in yet another manner. This graph shows the percentage of cows with SCC over the subclinical mastitis threshold. Producers should strive to have fewer than 15% of cows with SCC greater than 200,000 cells per milliliter.
4. SCC by test date and lactation group
Looking at SCC differences by lactation group can be especially useful toward distinguishing whether a mastitis problem exists in younger or older animals. With higher SCC in first-lactation cows, prevention efforts should be focused on heifer-raising programs. With higher SCC observed in older cows, dry cow management and milking procedures may be examined.
5. Percent of herd with SCC greater than 200,000 by lactation
This graph looks at trends in the percentage of subclinical mastitis cows by lactation group across time. Again, this graph can help identify whether to focus prevention on younger or older animals.
6. SCC by days in milk (DIM)
This graph can be used to identify any changes within the lactation. If SCC is highest in early lactation, dry and fresh cow management should be examined. This includes the effectiveness of dry cow antibiotics, use of a teat sealant, use of mastitis vaccines (particularly for E. coli), and hygiene and/or comfort of both dry and fresh cow facilities, including bedding choice. If SCC is low in early lactation but increases during lactation, milking procedures and lactating cow housing may be examined. Remember that SCC concentrations increase in later lactation because of reduced milk production, which increases the concentration of somatic cells.
7. SCC by test number
This graph shows similar trends to the DIM graphs, although the focus here is on DHI test number after calving.
8. SCC by pen
This graph shows the SCC and SCS by pen. This table can be used to assess differences among pens within the herd. If there are differences, are they because of how a particular group of cows is managed differently? Many times, there are logical explanations for a high SCC (i.e., a chronic or clinical mastitis group of cows) for a particular group. The sick or mastitis pen may be the highest, for example. But when there are not, more questions should be asked to determine why one particular group is higher than the others.
9. First-test SCC by test day
This graph depicts how “clean” cows are at the first DHIA test after freshening. This graph may reflect changes in dry or fresh cow management in early lactation and can be an indication of effectiveness of prevention practices during these periods. This is often a leading indicator of herd-level changes in SCC.
10. New subclinical mastitis at first test
This graph looks specifically at new subclinical mastitis infections at the first DHIA test after calving. This refers to cows with SCC less than 200,000 at dry-off and greater than 200,000 at the first DHIA test after calving. A good goal would be to have less than 10% of cows with new subclinical mastitis cases at first test. These cows developed a new infection during the dry period or soon after calving. Changes in the trends in these graphs could reflect differences in dry or fresh cow management.
11. Dry cure rate
This graph looks at changes in dry cure rate across time. A dry cure is a cow with a SCC greater than 200,000 at dry-off with a SCC less than 200,000 at first test. This is what we hope to happen with cows with high SCC at dry-off. The dry period is one of the most effective times to prevent new infections. A good goal for this would be that the dry cure rate is higher than the new infection rate.
12. Most recent SCS by previous SCS
As mentioned earlier, a cutoff of 200,000 cells per milliliter (equivalent to a SCS of 4.0) is used to define subclinical mastitis. Graphing changes in SCS can be useful. Figure 1 shows the SCS for the current DHI test and the last DHI test. This demonstrates changes in SCS from month to month.
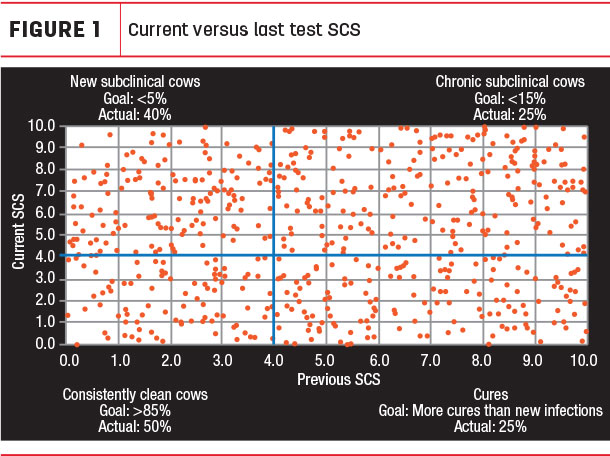
This graph divides the herd into four quadrants. The upper right-hand quadrant (III) represents chronically infected cows or those with subclinical infections (SCC greater than 200, SCS greater than 4.0) for both tests. The upper left-hand quadrant (II) represents new infections where there was no infection (SCC less than 200, SCS less than 4.0) for the previous test, with a subclinical infection (SCC greater than 200, SCS greater 4.0) for the second. The lower left-hand quadrant (I) represents consistently clean cows with no infection (SCC less than 200, SCS less than 4.0) for both tests.
Finally, the lower right-hand quadrant (IV) represents cures with subclinical infections (SCC greater than 200, SCS greater than 4.0) at the previous test, but no infection (SCC less than 200, SCS less than 4.0) at the current test. Goals for each quadrant are listed in these graphs. If a high percentage of the herd lies in the chronic infections’ quadrant, preventive efforts should be focused on control of contagious mastitis and milking procedures. These chronic cows should be cultured. If a high percentage of the herd is in the “new infections” category, changes in the environment or milking procedures should be examined.
13. Dry-off SCS by first-test SCS
Similar to Figure 1, Figure 2 shows changes in SCC from one lactation to the next by comparing the SCC from the first test in a new lactation to the last test from the previous lactation.
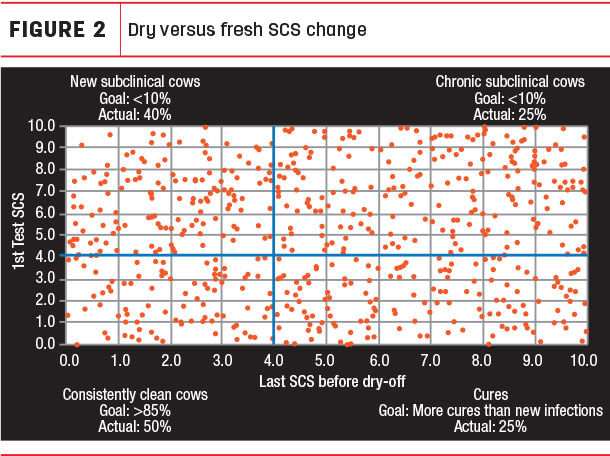
To an extent, this provides an evaluation of the effectiveness of dry and fresh cow management. If too many cows are in the upper right-hand quadrant, the dry cow program is not effective at controlling existing infections. More problematic would be scenarios where too many cows are in the upper left-hand corner, indicating cows developed new infections during the dry or fresh period. These situations would indicate a need to look at dry cow housing, environment, and preventive dry cow therapy, vaccination, dry cow nutrition and calving facilities.
14. Early dry -off candidates
This table lists cows to consider as early dry-off candidates. The default criteria for including cows on this report are milk less than 50 pounds, SCC greater than 200,000, pregnant, and due to dry off in the next two months. These are cows that the economics of continuing to milk may be questionable. This table may include the following information, which may be helpful for determining an appropriate course of action for each cow: cow ID, pen, milk value (dollars per day), last culture result, repro status, date due, days until scheduled dry-off, lactation number, most recent test-day milk, number of clinical mastitis events in lifetime, last culture result, date of last clinical mastitis and mastitis status.
15. Lists of potential mastitis culls
This table includes cows that might be considered for culling because of their mastitis status. The default animals to be included on this list are those with chronic mastitis status and milk less than 50 pounds. This table may include the following information, which may be helpful for determining an appropriate course of action for each cow: cow ID, most recent SCC, previous month SCC, third-most recent SCC, maximum SCC for this lactation, months of SCC over 200,000, current mastitis infection status, number of clinical mastitis events for this lactation, number of mastitis treatments for this lactation, date of last clinical mastitis event, last culture result, lactation number, most recent test-day milk, repro status, days carried calf, days since last breeding and times bred.
Using recorded mastitis and culture data for clinical mastitis evaluation
Accurate recording of clinical mastitis and culture data provides additional value beyond SCC data for those who record it well. With this data, the phrase “garbage in, garbage out” applies. The value of information is limited if it is not correct. Recording consistency across employees and time is critical. That starts with a consistent definition of clinical mastitis and when and how it is recorded.
16. Mastitis cases per month
This graph depicts the number of recorded clinical cases of mastitis per month. If the data is being recorded consistently, this graph can be useful for assessing trends for clinical mastitis rates. This graph can be useful for identifying new mastitis problems or the effectiveness of new treatment and control practices.
17. Fresh cow mastitis cases per month
This graph depicts the number of cases of mastitis for fresh cows (less than 30 DIM) per month. In considering trends across time, it is important to keep in mind differences in the number of cows freshening in a given month. An increase or decrease in cases may be a function of an increase or decrease in the number of cows calving.
18. Mastitis cases by DIM
This graph depicts mastitis cases by stage of lactation (DIM) which provides an indication of the timing of mastitis occurrence. Interpretation of this graph is like that of SCC by DIM. In general, risks for mastitis are higher in early lactation. However, an exceptionally high number of cases in early lactation may indicate a dry or fresh cow problem. Increases in midlactation may indicate more problems with contagious mastitis spread in the parlor or lactating cow housing. If mastitis cases are highest in early lactation, dry and fresh cow management should be examined. This includes the effectiveness of dry cow antibiotics, use of a teat sealant, use of mastitis vaccines (particularly for E. coli), and hygiene and/or comfort of both dry and fresh cow facilities, including bedding choice. If mastitis cases are low in early lactation but increase during lactation, milking procedures and lactating cow housing may be examined.
19. Mastitis cases by pen
Examining mastitis cases by pen may help to identify pen-specific issues relative to management or housing. For example, perhaps a pen is in a different barn with a different type of bedding that might contribute to mastitis. Or cows in another pen might have a longer wait in the holding pen. It could also be that a particular pen has more fresh or older cows.
20. Mastitis cases by lactation
Looking at clinical mastitis differences by lactation group can be especially useful toward distinguishing whether a mastitis problem exists in younger or older animals. With higher mastitis incidence in first-lactation cows, prevention efforts should be focused on heifer-raising programs. With higher mastitis incidence in older cows, dry cow management and milking procedures may be examined.
21. Cows with greater than or equal to two clinical cases of mastitis this lactation
This table shows cows with at least two clinical mastitis cases during the current lactation. These animals could be considered chronic mastitis offenders. This table could be useful for making culling, culturing or early dry-off decisions.
22. Culture distribution for past year
Farms that do on-farm culturing or send cultures to a laboratory for culturing have additional valuable information for evaluating mastitis management. Mastitis cases are also classified as contagious or environmental. Culture information can be helpful in determining whether the herd is dealing with a contagious or environmental mastitis problem. Additionally, high numbers of cases of particular bacteria can further refine control strategies. Contagious mastitis is transmitted from cow to cow or quarter to quarter. Most of this transmission occurs in the milking parlor.
23. Cultures collected by quarter for past year
This graph depicts the distribution of mastitis cultures collected by quarter. A high percentage of cases by a particular quarter could indicate problems within the milking equipment.
24. Cows with Staph. aureus, mycoplasma or Strep. ag. at last culture
This table provides a list of cows with contagious mastitis at the most recent culture event. These cows may be considered for culling, segregation or early dry-off. If possible, these cows should be milked last to minimize opportunity for the spread of mastitis to uninfected cows.
Looking at lists of mastitis cows can be useful for making culling or treatment decisions. However, if the highest-SCC cows are simply removed from the herd, other cows will take their place at the top of the list. Part of this is just simple math indicating that a cow will be the highest-SCC cow in the herd. Thus, it is also important to realize that eliminating high-SCC cows is only an emergency treatment of the problem without getting at its root cause. If you only focus on removing high-SCC cows from the herd without determining why these cows have high SCC and how to incorporate preventive practices, you will continue to cull or dump milk from top SCC cows test after test.
You may want to consider collecting milk samples for bacteriological culture for all cows with SCC greater than 200,000 for two consecutive months or at least the top 10 or 20 cows on the list. This would provide valuable information for developing prevention strategies and making individual cow treatment or culling decisions. Another caution is to not be too quick in culling high-SCC cows. It is best to make decisions based on multiple SCC tests and trends instead of a single cell count for a particular cow. The use of three consecutive monthly SCC tests will improve decision-making, especially when combined with other cow factors such as age, stage of lactation and time of year.
First, check to see if high cows are chronically high-SCC cows. Those cows are the most likely culls. If the SCC is high on a single test, the cow may recover on her own or with the assistance of treatment. Useful information to include in tables of subclinical mastitis cows includes cow ID, most recent SCC, previous month SCC, third-most recent SCC, maximum SCC for this lactation, months of SCC over 200,000, current mastitis infection status, number of clinical mastitis events for this lactation, number of mastitis treatments for this lactation, date of last clinical mastitis event, last culture result, lactation number, most recent test-day milk, repro status, days carried calf, days since last breeding and times bred. ![]()

-
Jeffrey Bewley
- Dairy Housing and Analytics Specialist
- Alltech Inc.
Mastitis severity
Mastitis is often characterized as clinical or subclinical. With clinical mastitis, visible signs of the disease are observable. These visible signs may include flakes or clots in the milk, swollen quarters, fever, loss of appetite, lethargy, depression and even death. With subclinical mastitis, there are no visible signs of the disease. The only indicator of subclinical mastitis is an elevated SCC.