Most readers are probably aware that the recent rally in milk prices is historically significant in that the nearly-$3-per-hundredweight (cwt) climb in futures prices is quite rare. The last time we witnessed milk prices and underlying spot cash cheese values this high during January was back in 2008.

While it certainly is significant that prices have not been this good for dairy producers in six years, what may be lost is what these prices mean from a profitability standpoint given current feed costs.
One way to objectively measure profit margins is to rank them within a historical context, as feed costs and milk pay formulas vary from one region to another. Various metrics can be employed, such as a generic milk-over-feed ratio or more farm-specific calculations that take into account unique variables of an individual dairy.
Either way, you are essentially looking at where milk values are relative to the cost of producing that milk – focusing on feed costs in particular, which represent a majority of the variance over longer time horizons.
Whether you calculate some sort of general ratio or a specific profit margin unique to a particular dairy, you can look at where this value ranks over a historical period of time such as 5, 10 or 15 years and measure it on a percentile basis.
Current Q1 dairy profit margins rank at the 99.97th percentile of the previous 15 years. What exactly does this mean? Well, suppose your child tested in the top 10th of 1 percent of all students nationally. He or she would be considered a genius and likely on a fast track to a scholarship at an Ivy League university.
If your annual income clocked in at the top 10th of 1 percent nationally, you would be in the crosshairs of the Occupy Wall Street movement. Suffice it to say that the profitability profile for dairies right now is extremely favorable in the current period, but beyond Q1 it is projected to stay that way for some time, also.
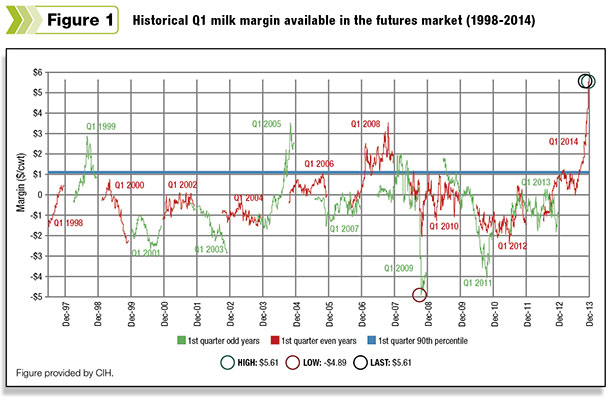
Figure 1 shows just how strong Q1 margins are from a historical perspective. The figure details 15 years of profit margin history for this model dairy in the Upper Midwest, holding fixed costs steady, as they are currently projected today, and fluctuating milk prices against feed costs going back in time.
What you will notice is that the current profit margin projected at $5.61 per cwt is an all-time high for this history by a long shot. The two other first quarters that exceeded a $3-per-cwt profit margin include Q1 2008 and Q1 2005.
The first quarter of 1999 was likewise a strong period for dairy profit margins, although notice that the opportunity to achieve those margins actually took place in the fall of 1998, and the actual profitability during the Q1 1999 marketing period was much lower.
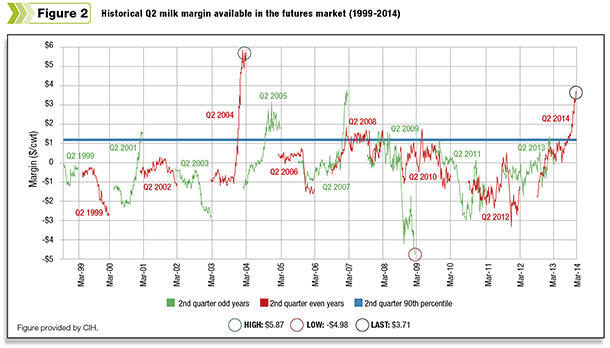
This brings us to Figure 2 , which is the history for Q2. While the current projection for profit margins in the second quarter of 2014 at $3.71 per cwt is not nearly as strong as that for Q1, at $5.61 per cwt, it is interesting to note that this still represents the strongest profit margin for Q2 since 2007 and the third-highest in this history, ranking only behind 2004.
It is also worth pointing out that this profit margin represents the 98.85th percentile of the past 15 years. While you may not technically be in the top 1 percent at this reading, it nonetheless represents the best opportunity you have had in years as a dairy producer to protect profitability in a period that we are not even in yet.
While both the second quarters of 2007 and 2004 finished at their highs, it should be noted that this is not always the case in periods witnessing strong margins. Sometimes the best opportunity to capture a historically strong margin will occur well ahead of the actual marketing period.
While 2014 may very well prove to be a repeat of both 2007 and 2004, there is no guarantee that profit margins will continue to improve into the spring or that they will even be as strong then as they are projected to be right now. Figure 2 shows the history for Q2 profit margins.
What about the second half of 2014 or even out into 2015? Profit margins in these periods are historically quite strong as well. The current Q3 profit margin for this same model dairy is currently projected at $3.16 per cwt at the 95.07th percentile of the past 15 years.
The Q4 profit margin is projected at $2.76 per cwt, which represents the 94.72nd percentile. For reference, the highest margins observed for each of these two quarters for this model dairy are $6.86 per cwt and $4.86 per cwt, respectively.
In the first quarter of 2015, current profit margins are projected at $2.18 per cwt while in Q2 2015 the profit margin is calculated at $2.12 per cwt. Both of these are just under the 95th percentile of the past 15 years at 94.76 percent and 94.62 percent, respectively.
While one might look at the gap between current projected margins and the highest observed levels thinking about the current first quarter, you might be tempted to “let the margin come to you” with the expectation that margins will continue to improve as we move into these marketing periods later this year and next.
It is easy to be complacent when times are good, and certainly we have heard the sentiment expressed from many of our own clients that they “need every last penny of margin now” to pay for past losses as they try to build equity back into their businesses.
I am quite sympathetic to this message and would not want to suggest that margins are inevitably going to collapse as I ultimately don’t know what will happen as we move forward in time.
What I do know is that these are rare times when we are not only witnessing spot margins at all-time highs but seeing forward margin projections basically at or above the 95th percentile of the past 15 years for more than a year out in time.
I also know that there are many strategies dairy producers can take advantage of to secure margin protection this far forward in time without capping their ability to participate in stronger profitability should that ultimately play out as we move through the year.
As you consider the many resolutions you typically make at the start of any year, maybe you should resolve to take advantage of the unique opportunity the market is giving you to secure not only profitability this year, but out into next year as well. Happy New Year! PD

Chip Whalen
Vice-President of Education and Research
CIH – Commodities & Ingredient Hedging LLC


