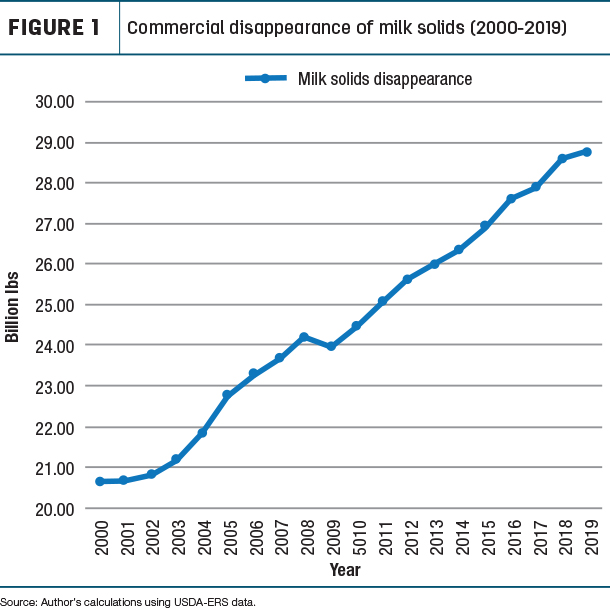
Since the beginning of the 21st century, commercial disappearance of milk solids (milkfat plus nonfat solids) increased almost 40%.

Milk solids disappearance went from 20.6 billion pounds in 2000 to 28.7 billion pounds in 2019 (see Figure 1).
As I’ve written about previously, using milk solids (milkfat plus nonfat solids) instead of pounds of dairy products sold or pounds of milk produced provides a more accurate measurement of supply and demand.
Total (domestic and export) milk solids disappearance slowed in 2019. It only increased 0.6% from 2018, the lowest annual increase since 2009. However, 2019 was a banner year for domestic disappearance. Domestic disappearance of milk solids in 2019 was a record 24.7 billion pounds, 2% higher than in 2018. During the first decade of the 21st century, domestic dairy disappearance increased at an annual rate of 1.1%. During the recent decade, the increase jumped to 1.5%.
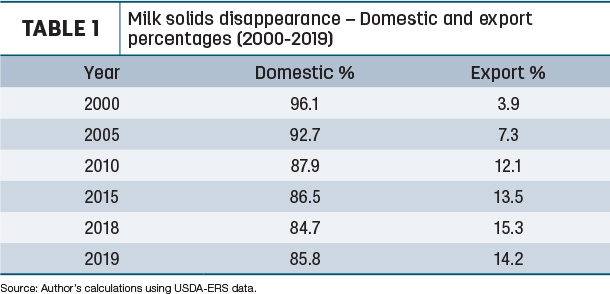
Disappearance of milk solids through exports was 7% lower in 2019 compared to 2018. This is the reason for the smaller increase in total demand (domestic and export) last year. Even though exports were lower, 2019 was the second-highest year for exports, only trailing 2018. Back in 2000, exports only accounted for 3.9% of milk solids disappearance. Last year, it was 14.2% (see Table 1).
Separating domestic demand into milkfat and nonfat solids, we find milkfat is driving demand. Since 2000, milkfat disappearance increased 36%, while nonfat solids domestic disappearance increased 19%. Increased consumption of cheese and butter help explain the higher increase for milkfat. Cheese averages about 28% and butter 80.5% milkfat. From 2000 to 2018 (most recent year available for individual products), cheese and butter’s total use of milkfat increased 54%.
Opposite of domestic demand, over 90% of milk solids exported are nonfat solids. This is expected with nonfat and skim milk powder, along with various whey products, being the major dairy products exported. In 2019, 65% of nonfat dry milk powder, 35% of dry whey, 50% of whey protein concentrate, and 68% of lactose production were exported.
Milk solids assist us in better monitoring demand of individual dairy products as well. Starting last November, the USDA’s Economic Research Service (ERS) provides annual milkfat and nonfat solids utilized by various dairy products. Using this data, the estimated percentage of milk solids utilized by various dairy products was calculated.
As shown in Table 2, cheese is the major user of milk solids.
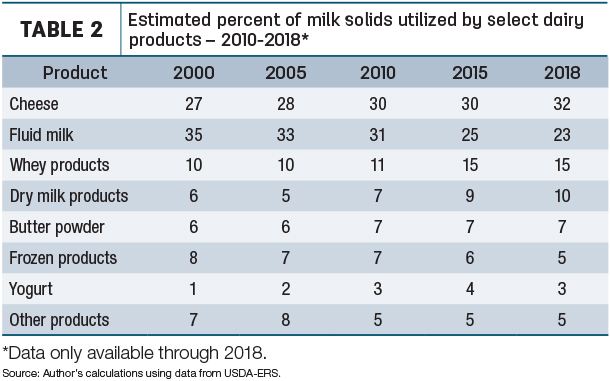
Cheese increased its share of milk solids utilized from 27% in 2000 to 32% in 2018. In that whey is a byproduct of cheese, both products combined utilized 47% of milk solids in 2018. At the current rate of growth, the cheese industry could soon be utilizing at least one-half of all milk solids production.
Even though fluid milk went from using the largest share of milk solids in 2000 to only 23% in 2018, it is still the second-largest user of milk solids. Plus, fluid milk remains the largest user of nonfat solids. It is unlikely we would know that fluid milk is still such a large user of milk solids by only measuring demand by pounds of product. In addition, the average milkfat percent of fluid milk increased from 1.82% in 2011 to 2.06% in 2018. Consumers are shifting to higher-fat milk.
Looking at other products, yogurt showed growth from 2000 to 2010 but, since 2018, milk solids utilized through yogurt have declined slightly. Likewise, frozen products were steady from 2000 to 2010 but have been on a decline since. Dry milk products, which include nonfat and skim powder, have grown, especially since 2010, and utilized 10% of the nation’s milk solids in 2018. Increased exports are driving more milk solids used in dry milk products.
Supply
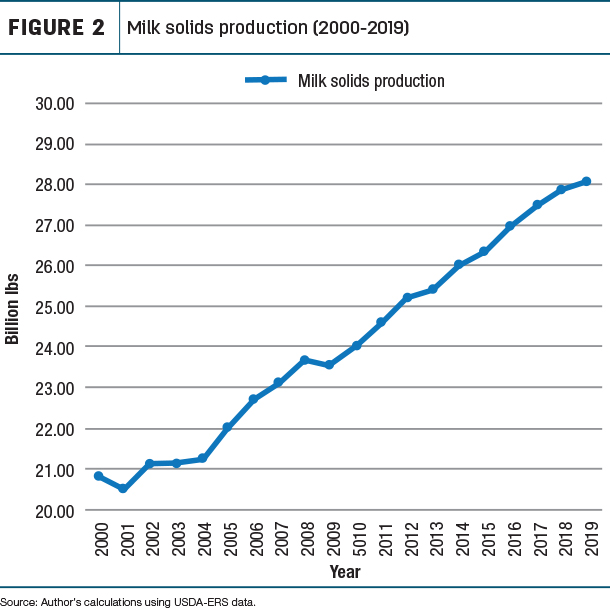
Now turning to the supply side of the equation, milk solids production in 2019 compared to 2018 was only 0.63% higher, just slightly more than the increase in demand. This is the lowest annual production increase since 2013 and less than one-half the increase from 2017 to 2018. The close supply-to-demand ratio was a primary reason for higher milk prices in 2019. Production of milk solids increased from 20.8 billion pounds in 2000 to 28.1 billion pounds in 2019 (see Figure 2).
We need to point out, pounds of milk produced in 2019 was 0.34% more than 2018, about one-half of milk solids increase. About 75% of the nation’s milk production is manufactured into various dairy products and ingredients. The more solids in milk, the more pounds of manufactured products from the same volume of milk. Again, this shows measuring production by milk solids better indicates change in milk supply.
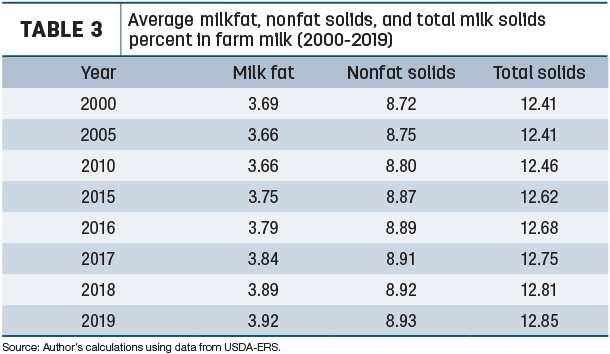
Milk solids production increased more than milk pounds because dairy farmers are increasing the milkfat and nonfat solids content in their milk production. From 2010 to 2019, milkfat percent increased from 3.66% to 3.92%. Nonfat solids percent increased from 8.8% to 8.93%. Dairy farmers continue to produce milk with a higher concentration of milk solids (see Table 3).
In looking at milk supply, we must also consider imports. Imports represented 2.6% of the milk solids supply in 2019. Since 2010, the percent of imports ranged from a low of 2.3% to 2.9% of the supply of milk solids. One important change in imported dairy products is the shift to milkfat. For the last three years, milkfat was over 70% of imported milk solids. Ten years ago, it was less than half of dairy imports. Butter is likely the main reason for the shift. The high domestic butter price relative to the world price, in recent years, made imported butter more competitive. Plus, the increased consumer demand for certain imported butter.
In summary, demand for dairy products continues to grow, led by cheese and whey. Even though fluid milk sales are in decline, this dairy category is the second-largest user of milk solids and the largest user of nonfat solids. Dairy farmers continue to meet dairy demand by producing more milk solids – not just more milk solids from producing more pounds of milk but more milk solids per pound by increasing the percentage solids content of milk as well. Due to the varying milk solids content in dairy products, and farm milk containing a higher percent of milk solids, monitoring milk supply and demand by milk solids is a more accurate indicator.