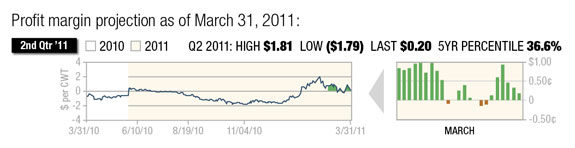
Dairy producers have continued to see favorable profit margins since the end of the first quarter. While feed costs have been climbing, this has been more than offset by higher milk prices so that the overall profit margin has held steady and even managed to improve through the second quarter of 2011 (see chart at right). This certainly is a welcome development as dairymen struggle to build back lost equity over the past few years in what has been a brutal period of negative margins for the industry.

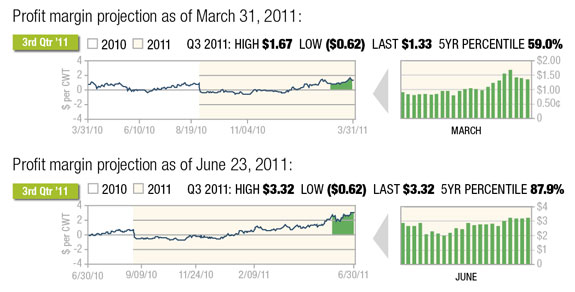
While projected profitability through the end of the year may not necessarily hold up as we move through the summer and fall, positive margins can nonetheless be secured right now and look particularly attractive in nearby Q3 which is at the 88th percentile of the past five years, compared to the 59th percentile at the end of the first quarter.
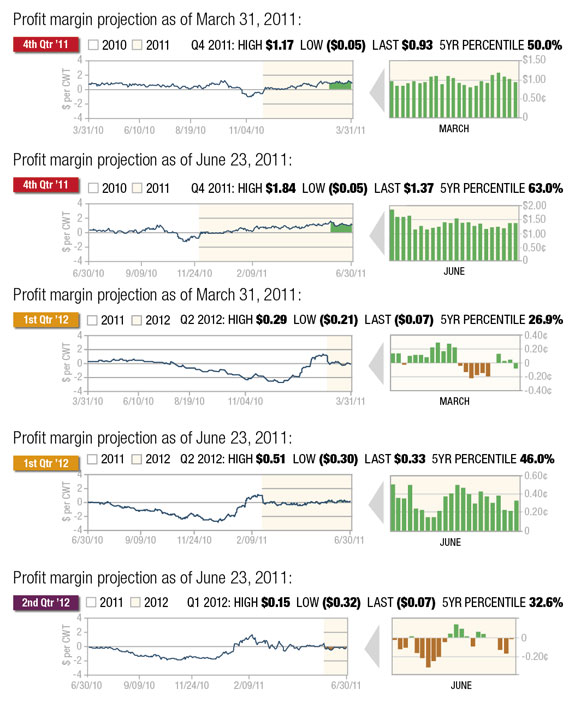
The charts below reflect both the current outlook for dairy margins through the second quarter of 2012 as well as comparison graphs to these same forward profit margin projections back in March. You will notice that all periods project an improved margin outlook to what was available previously, although forward margins in Q4 and Q1 2012 are only about average from a historical perspective, with deferred Q2 2012 margins below average at the 33rd percentile of the past five years.
Milk prices continued to increase over the past few months, as dairy product prices have been supported by strong demand. Block and barrel cheese at the CME has consistently been bid higher since the middle of May with few offers for sale, allowing prices to rise in a vacuum. Demand appears to be very solid based upon stocks data.
An indication of strong disappearance is a contra-seasonal decline in cheese stocks this spring. Manufacturers have been unable to build stocks as they normally would this time of year, with holdings of American cheese on May 31 totaling 620.5 million pounds – similar to the level at the end of February according to the latest USDA Cold Storage report.
Over the past 10 years, American cheese inventories have, on average, increased 32.4 million pounds during the March-May period. The data also revealed that while butter inventories expanded in May, they nonetheless remain at their lowest level in the past 10 years at 170.4 million pounds.
It should be pointed out that cheese prices have recently risen above Oceania values, which may temper further gains without indications that milk production is declining.
Milk production has increased seasonally so far this year, with the latest report reflecting May production up 1.3 percent from a year ago at 17.27 billion pounds. Cow numbers also increased by 13,000 head during the month to reach their highest level in two years.
It may be that expectations for continued year-over-year growth in milk production and concerns about the strength of forward demand, given recent economic weakness, could be the reason for the discount in forward futures values relative to the spot market. This is the main reason why profit margins are not as strong in Q4 through Q2 of 2012 compared to nearby Q3.
On the cost side of the margin equation, corn prices recently collapsed following the release of USDA’s June acreage and quarterly stocks reports, while soybean meal prices have also softened this spring due to lackluster demand. The corn ethanol grind has been very strong, which is allowing more DDGS availability to domestic livestock producers and thus displacing protein meal in feed rations.
There remains concern that a tight soybean balance sheet this season coupled with a potential decline in both soy acreage and yield may cause prices to spike later this summer into fall, although for now soybean meal is trading at its lowest price since December of last year. While corn prices generally have been stronger through Q2, they recently were down 20 percent from their highs in early June following two watershed reports from the USDA.
Both reports presented a more bearish outlook for the corn market than what analysts had previously assumed, although there remains concern that the numbers are subject to revision and the yield on this year’s crop has yet to be determined.
It should be pointed out that the June acreage report has been above the final corn acreage level in 15 years out of 20 years, or 75 percent of the time. The average deviation has been 481,000 acres with a range of 24,000 to 1.35 million acres.
USDA reported June 1 corn stocks of 3.67 billion bushels, which was 346 million above the average trade guess as well as outside of the range of pre-report expectations between 2.998 – 3.515 billion bushels. Similar to the acreage figure, the June 1 stocks came as a big surprise to market participants looking for a lower level of stocks in storage.
Given that both export and ethanol demand are largely transparent, the quarterly stocks figure helps to reconcile disappearance accounted for in feed and residual usage which is harder to measure. The June 1 stocks suggest that Q3 usage in this category (March/April/May) declined 44 percent from a year ago and would be the lowest Q3 feed and residual usage in three decades.
This does not seem to jibe with the fact that Q2 usage (Dec/Jan/Feb) was up 14 percent from last year based on March 1 stocks. While the discrepancy may be worked out by the time the September 1 stocks figure is reported on September 30, the June 1 stocks would seem to indicate that high prices accomplished their chore of rationing demand this spring, and as a result, corn stocks will not be as tight as previously assumed heading into the final quarter of the marketing year.
The market will also be sensitive to the outlook for soybean production as the supply/demand balance there is very tight. While the USDA indicated June 1 soybean stocks larger than pre-report market expectations, acreage was lowered from the March Planting Intentions which will raise sensitivity during the pod-fill stage of development in August.
The USDA reported June 1 soybean stocks at 619 million bushels versus the average trade guess of 597 million, but within the range of expectations between 549-632 million.
Similar to corn, it appears that high Q2 prices effectively rationed demand, particularly for domestic soybean processors due to poor crushing margins. Soybean acreage was reported at 75.2 million, down 1.4 million from the March Planting Intentions as well as below the range of expectations between 75.5-77.2 million acres.
While the quarterly stocks figure was above expectations, the lower acreage figure suggests that even with trend-line yields and given the demand estimates in the June World Agricultural Supply and Demand Estimates report, carryout next season will be back to pipeline levels. As such, any threatening weather during pod-fill in August will not be well-received by the market.
From a strategic standpoint, much can be done to protect forward profit margins at current levels. Alternatives exist in the cash market to secure both milk sales and feed purchases. Many co-ops and creameries offer forward pricing contracts where deferred CME milk futures values can be secured.
Alternatively, some also offer flexible pricing strategies that will protect a floor or minimum price value for a cost. This cost can also be reduced by accepting a ceiling or maximum price above the market. For those producers that don’t have these pricing mechanisms at their disposal, the futures market can be used to structure similar protection independent of the co-op or creamery.
In addition, strategies can be employed to either protect against higher feed costs before committing to purchases in the cash market, or to protect against a loss of inventory value on feed rations already purchased.
Before considering any particular strategy on either the cost or revenue side, one first must evaluate the overall profit margin being projected for the given period. This will help determine how much cost you can afford to assume, as well as how much flexibility is needed around any piece of the overall profit margin.
Perhaps milk prices are high, but feed costs are also high. One might consider trading off less flexibility to capture higher milk prices in exchange for the opportunity to benefit from lower feed costs.
Conversely, in an environment of very low prices, one might consider retaining the opportunity to participate in higher milk values, but make sure adequate protection is also structured against potentially higher feed costs. Either way, the projected profit margin itself should be the roadmap to help fine-tune the individual strategies being employed to direct the course of protection.
Understanding what forward margins are, as well as what strategies are available to protect them, will ultimately give you greater control in your dairy operation. PD
Whalen is a senior risk manager and director of education for Commodity & Ingredient Hedging based in Chicago, Illinois. E-mail him at cwhalen@cihedging.com

-
Chip Whalen
- Senior Risk Manager and Director of Education
- Commodities & Ingredient Hedging, LLC
- Email Chip Whalen

