
Over the past two years, the Federal Reserve has been performing “stress tests” on the largest U.S. banks. “Stress tests” are used to better understand a business, its weaknesses and how much financial stress the key drivers of a business can withstand. They are becoming more widely used due to a more volatile economy. Dairies have experienced record levels of volatility over the past two years and are now being stress tested by lenders for milk price and feed cost changes.

Once we understand how sensitive the changes in the key economic drivers are, different cash flow scenarios can be developed (most likely, downside and worst-case) and a plan can be developed to manage through a worst-case scenario.
Stress testing for dairies can be looked at in terms of cash flow and borrowing capacity stress testing.
Cash flow stress testing
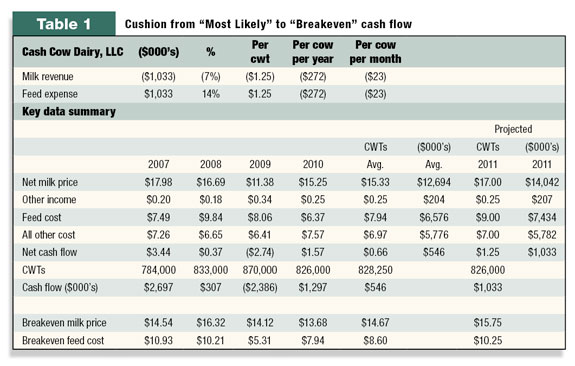
Cash flow stress testing is analysis of how much cash flow cushion a dairy has to absorb a potential drop in milk price or increase in feed costs. To exhibit this, here are a few calculations for Cash Cow Dairy LLC (see Table 1 ).
• The first step is to review historical data to get a feel for historical cash flow, milk price breakeven and feed cost breakeven. Cash Cow Dairy’s cash flow followed milk price and feed cost trends. This dairy did not hedge any milk or feed.
Cash flow was strong in 2007 (high milk prices), near breakeven in 2008 (moderate milk price/high feed cost), negative in 2009 (low milk prices) and moderate in 2010 (moderate milk prices).
On average, over a four-year horizon (a reasonable slice of dairy history blending good and bad years), the dairy generated an average cash flow of $.66 per hundredweight (cwt) or $546,000, a breakeven milk price of $14.67 per cwt and a breakeven feed cost of $8.60 per cwt.
• The second step is to construct a “most likely” cash flow projection with realistic expectations of milk price and feed costs. In Table 1 , a $17-per-cwt milk price and $9-per-cwt feed cost were used. The cash flow shows a $1.25 per cwt cash flow margin.
Compare the historical average to the projected. The net cash flow is moderately positive, but this is based on a milk price and feed costs that are both near historically high levels that look similar to 2008. What followed 2008? The disaster of 2009. Something to think about and maybe a takeaway from analyzing the dairy cash flow data.
• The third step is the cash flow “stress test.” There are many moving parts to a dairy’s cash flow that can be stress tested, including production per cow, increase in operating costs (not feed), increase in cull rates, higher interest rates, etc.
However, the impact of changes in any one of these factors pales in comparison to the impact on cash flow of changes in milk price and feed cost. Net milk revenue represents over 90 percent of the dairy’s cash inflow and feed costs represent 45 to 60 percent of the dairy cash outflow.
Above right (see Table 1 ) is a stress test that determines how much of a change to milk prices and feed costs a dairy can sustain to reach a breakeven milk price and breakeven feed cost. Cash Cow Dairy can absorb relatively small changes to milk price (7 percent decrease) or feed cost (14 percent increase) before cash flow turns negative and borrowing is required to cover losses.
To put the feed cost stress test in perspective, if all of your feed ingredients cost you on average $200 per ton ($5.50 per cow per day), you would hit breakeven if the costs rose to $228 per ton ($6.27 per cow per day), not a lot of margin for error.
Another stress test is to test a combination of feed costs and milk prices in what can be labeled as the “downside” scenario. This is an estimate of what reasonable negative changes in milk prices and feed costs could occur and the impact of these changes on cash flow. Let’s say the downside scenario is feed costs increase by 6 percent (to $9.50 per cwt) and milk prices drop by 6 percent (to $16 per cwt).
The combination would reduce net cash flow by $1.50 per cwt to $.25 per cwt or $206,000. Choose milk prices and feed cost changes that have a reasonable chance of occurring. Obviously, if both milk prices and feed costs are working against you, the amount of change in each factor the dairy can support is less.
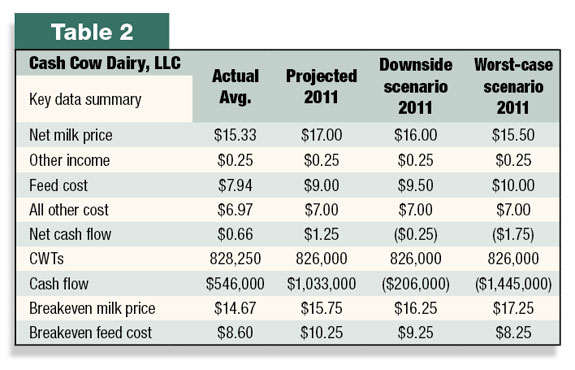
After you have a determined a “most likely” scenario and a “downside” scenario, one can get more pessimistic and stress test the cash flow more with a “worst-case” scenario.
Table 2 assumes a $15.50 per cwt milk price and a $10-per-cwt feed cost, which results in negative cash flow of $1,445,000 or $1.75 per cwt.
Now that you have looked at historical cash flow, projected cash flow, a downside scenario and a worst-case scenario, you can move from cash flow stress test to equity/capital stress test. How much capital/borrowing capacity does the dairy have to sustain losses under the downside and worst-case scenarios?
The losses can be funded by three sources: borrowed funds, sale of assets or a cash injection from outside the business. Most lenders would like to see the dairy be capable of funding a loss in the worst-case scenario.
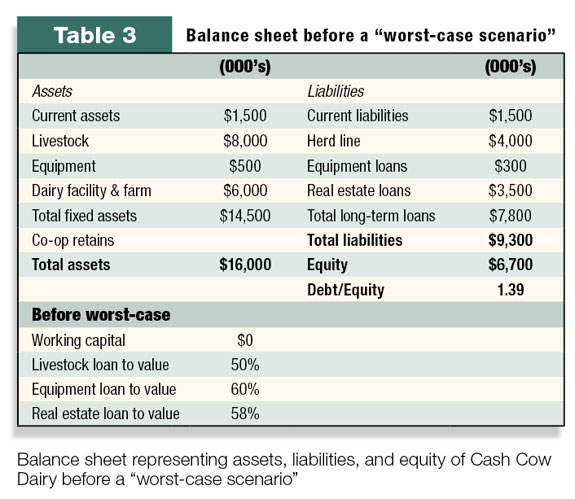
Table 3 is a balance sheet representing assets, liabilities and equity of Cash Cow Dairy before a “worst-case” scenario:
The second phase of the stress test is to answer the following question: Where will the cash come from to fund losses in a “worst-case” scenario? Liquidity sources such as stretching payables, borrowing feed equity or cash reserves are not available.
Real estate is lent 58 percent, near maximum bank lending parameters in today’s environment. Equipment is fully leveraged.
One of the only potential sources of cash to fund the negative cash flow would be to borrow $1,445,000 on the herd line, which would require an increase to the herd loan to value by 20 percent, from 50 percent to 70 percent.
The positive is that equity is maintained in livestock to support the loss. The negative is that every asset will be fully leveraged after the worst-case scenario and leverage will have increased from 1.39 to 2.04:1 (your lenders have twice as much cash at risk than you do).
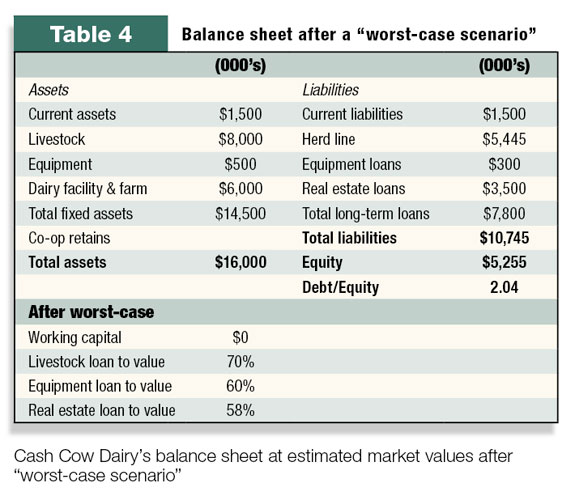
Table 4 is Cash Cow Dairy’s balance sheet at estimated market values after “worst-case” scenario.
In conclusion, many lenders are performing stress tests to see how sensitive a dairy’s cash flow is to changes in the key drivers of dairy cash flow (milk prices, feed costs, production per cow, etc.). Each lender has their own methods of calculating the stress tests, and each has their own unique way of interpreting the data.
Your lender may be performing stress tests, analyzing your financial information and trying to determine how you will manage through a “worst-case” scenario. Lenders desire their borrowers to be proactive and communicate their thoughts, perspectives and knowledge in these areas. Your loan officer would appreciate the following information and discussion:
1. Develop three cash flow scenarios: most likely, downside and worst-case
2. Calculate your milk price breakeven, feed cost breakeven and production per cow breakeven
3. Communicate a plan to manage through a “worst-case” scenario
4. Understand Class III milk futures, milk hedging, feed hedging and feed contracting options as well or better than your lender to discuss the potential for using these tools to manage risk
5. If your debt/equity is high, working capital is low, borrowing capacity is low and you are not proactively managing milk and feed price risk, you are extremely vulnerable. In this volatile dairy environment, both the borrower and banker should be concerned.
6. Given the significant risks in milk price and feed cost, focus on how risk in these areas will be mitigated
7. Liquidity is critical. Ability to access cash to get through a down cycle is key. Consider maximizing long-term debt to reduce short-term debt in good times. Long-term real estate loans are tougher to come by when the dairy industry is bleeding red ink. PD
References omitted due to space but are available upon request to editor@progressivedairy.com .
PHOTO
Your lender may be performing stress tests, analyzing your financial information and trying to determine how you will manage through a ‘worst- case’ scenario. Photo by www.thinkstock.com .

Arthur Moessner
Regional Vice President
Bank of The West
amoessner@bankofthewest.com