Like many of you, I attend many dairy meetings and am fortunate to have the opportunity to speak at many of them. In my interactions with dairy farmers and other industry people at these meetings, I find there is not a good understanding of what is happening with demand for dairy products.

There are reports showing cheese, butter or fluid milk sales and the volume of dairy products exported. All of this is good and important information. In fact, I use some of this information in my presentations. However, just reporting sales or demand information for individual products or markets does not give us a clear, concise understanding of what is taking place in regard to demand for dairy products.
One of the challenges in reporting and understanding dairy demand is: Different dairy products contain different levels of milkfat and nonfat solids (lactose, protein and other nonfat solids). For example, butter is mostly milkfat while nonfat or skim milk powder is mostly nonfat solids.
Whole fluid milk contains more milkfat than reduced or low-fat milk, but reduced and low-fat milk contain more nonfat solids than whole milk.
Because of the variation in milkfat and nonfat solids among dairy products, it is difficult to get a complete picture of overall dairy demand just from looking at individual dairy product demand. Strong growth in one dairy product can skew our thinking about the actual growth in total dairy demand.
On the other hand, we all know farm milk contains both milkfat and nonfat solids. To fully understand if dairy demand is increasing, decreasing or staying the same, we need to know the demand for all of the solids in milk production.
What I find helpful in talking about dairy demand is expressing it on a total solids basis, milkfat plus nonfat or skim milk solids. For many years, the USDA’s Economic Research Service (ERS) has published, monthly data showing commercial disappearance (the USDA’s term for demand) for dairy products by milkfat and skim milk (nonfat) solids. The ERS data can easily be combined into total solids.
Plus, the ERS milk and skim solids data is separated into domestic and export disappearance, providing even more information about dairy demand.
Total solids provides better insight into the demand for all of the solids in milk, both in domestic and export markets. Plus, it helps us better understand the relationship of demand to milk prices. Let’s take a brief a look at what total solids is telling us about dairy demand.
During the past 10 years, demand measured by total solids has increased every year except 2009 (Figure 1).
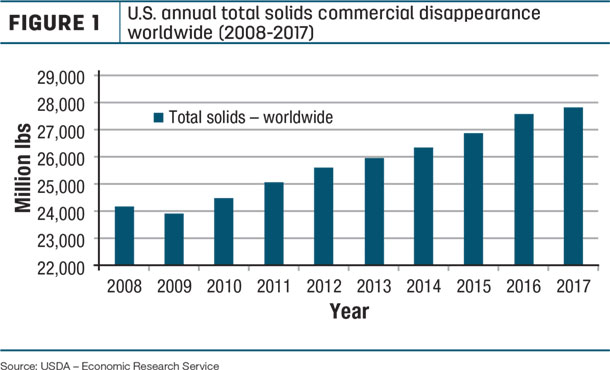
This provides us some explanation for the disastrous milk prices in 2009. Demand last year was higher than 2016 but only up 0.8 percent. Unfortunately, this was the lowest increase in demand since 2010. In the two previous years, 2015 and 2016, total solids demand was up 2.1 percent and 2.6 percent, respectively.
Again, these changes in demand, over the past three years, provide some understanding into why milk prices have moved lower, and dairy product inventories are building. Our understanding expands even more when we consider the increase in milk production in 2017 of 1.8 percent was more than double the increase in demand of 0.8 percent.
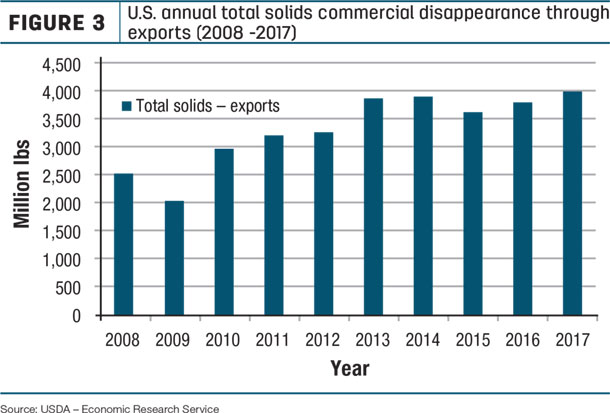
Let’s drill down further into total solids to learn more about demand by looking separately at domestic and export demand. Domestic total solids demand is shown in Figure 2, and Figure 3 shows export demand.
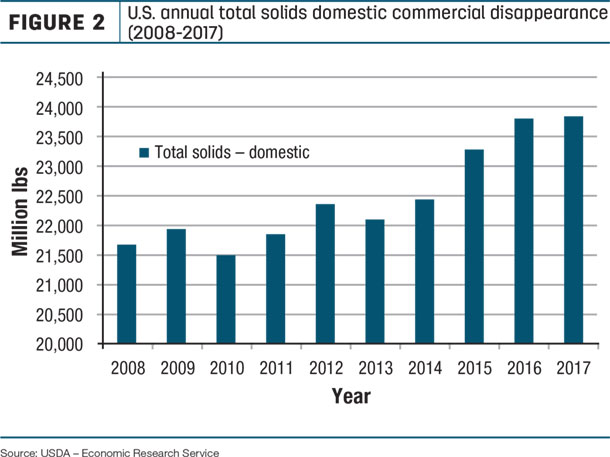
When looked at separately, we see more variability in demand than when combined. Thankfully, there are years when a decline in domestic demand is offset by an increase in exports and vice versa.
 Examining just domestic demand we see a nice jump from 2014 to 2015. However, domestic demand has remained relatively steady since then. Looking at individual product sales data shows 2015 was an exceptional year for dairy demand for most products.
Butter sales increased 2.2 percent, both American and other cheese were up 3.4 percent, and fluid milk sales had one of its lowest declines in many years. On the other hand, domestic demand was only up 0.1 percent in 2017, the lowest increase since 2013.
If total demand was up 0.8 percent in 2017, and domestic demand was up only 0.1 percent, it is obvious exports played a major role in demand. On a total solids basis, 2017 was a record year for U.S. dairy exports, with 3.985 billion pounds of total solids exported (Figure 3). This is slightly higher than the previous record of 3.916 billion pounds in 2014.
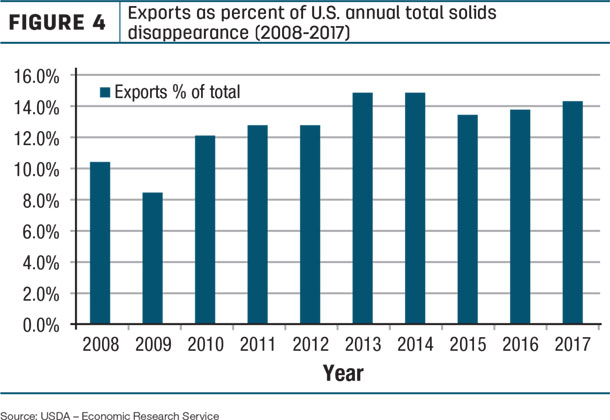
When it comes to exports, the U.S. primarily exports nonfat solids. In 2017, over 90 percent of total solids exported were nonfat solids. These nonfat solids were mainly in the form of nonfat and skim milk powder, lactose and whey products with some cheese. On a total solids basis, exports represented 14.3 percent of total solids demand in 2017. In 2009, it was only 8.4 percent (Figure 4).
In summary, my own experience has convinced me dairy farmers and others in the industry better understand dairy demand when expressed on a total solids basis. Hopefully, this article will encourage you to follow demand on a total solids basis as well. It provides a clearer picture of overall demand for the nation’s milk production and the solids in that milk. ![]()
Calvin Covington is a retired dairy cooperative CEO and now does some farming, consulting, writing, and public speaking.

-
Calvin Covington
- Retired Dairy Co-op Executive
- Email Calvin Covington


