With the end of another year, now is the time to brush up on key financial ratios and cost drivers that will assist in evaluating your farm’s performance. Taking time to review these metrics will also help you make decisions while planning ahead for the upcoming year.

Liquidity and solvency
Working capital tells us how much liquidity is available to a business for regular operations. Working capital is calculated by taking current assets minus current liabilities. Typically we take it one step further and divide that number by the average total herd size. As a reminder, current assets include:
- Balances of all checking accounts and other cash on hand
- Accounts receivable including milk receivable, or the portion of the milk check you produced in the previous month, but have not been paid for yet
- Feed inventory
- Value of hedge accounts
Current liabilities should always include:
- Operating loans
- Payables
- Current portion or the total amount of long-term principal payments that are due in the next 12 months
A good target to shoot for is $400 to $600 of working capital per cow.
To begin calculating working capital, review the last 12 months of your cash income statement. Exclude any cash flow from loans, sum up the cash flows and divide by 12 months to determine your average “burn rate” per month of cash. That tells the rate at which the business spends money in excess of income and will allow you to calculate how long you can continue the trend of a negative cash flow.
Next, add the amount of cash you have on hand, the amount of current assets you can immediately convert to cash and the amount available on any operating loans.
As an example, let’s say the dairy in Table 1 has been averaging a $70,000 shortage of cash flow each month, including debt service.
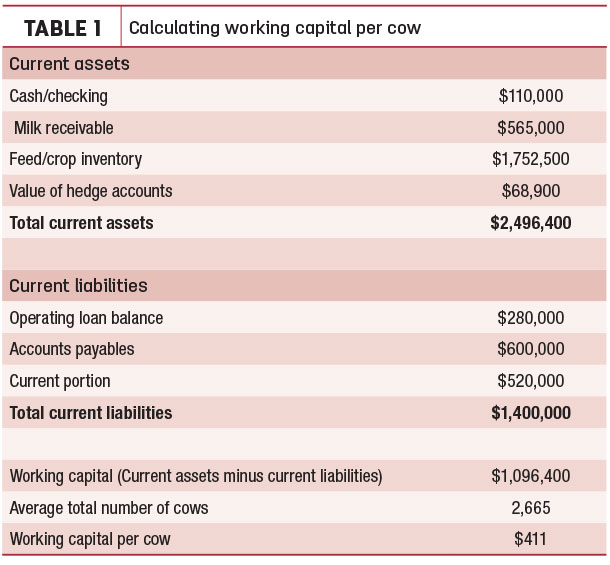
By looking at current assets, the producer believes that $330,000 of the $2.4 million is immediately available as cash and $470,000 is available on the operating loan, meaning the total availability is $800,000. Dividing $800,000 by the loss of $70,000 a month suggests that the burn rate will carry them for approximately 11 months before there is no cash available to them to service the cash shortfall.
Make a goal to have at least one year of cash reserve, not including use of the operating loan. In this example, we didn’t use operating dollars in our calculation; adding that shows this farm really only has four months of burn rate left.
Equity change
Return on equity (ROE) indicates the efficiency of money invested in a business. Gaining 10 percent ROE every year may be unreasonable, but targeting 4 percent or more each year is a fair starting point. However, given the dairy margins over the last four years, several businesses have burned through equity, whether it is through increased borrowing, increased payables or a combination of the two.
In early 2018, several dairies budgeted a projected 5 to 7 percent loss by year-end. Calculating equity burn is just as important as knowing your cash burn rate as part of a long-term strategic plan. Additionally, with current market conditions, producers need to take a discount factor on asset values, including cattle, machinery and feed, in the event that they look to sell out.
Equity erosion can happen must faster than expected due in large part to a compounding effect of operational losses and market discounts on asset values. You can track ROE by taking annual net income and dividing by your equity position on Dec. 31, 2017. However, be cautious of any potential swings in equity change throughout the year, like gifting of assets or capital contributions. The longevity of the business is heavily influenced by ROE.
Debt
Term debt coverage (TDC) or debt service coverage ratio (DSCR) is the ratio of earnings available to service principal and interest payments. TDC is calculated by taking pretax income (not including depreciation or interest expense) and dividing it by the term interest and principal payments. As an example, let’s say a business has $200,000 of accrual earnings with $450,000 of depreciation, $350,000 of interest payments and $300,000 of principal payments. This business would have a TDC of:
($200,000 + $450,000 + $350,000)/($300,000 + $350,000) = 1.53 X 100 = 153 percent
At 100 percent, the earnings were able to cover expenses and service term principal and interest. A target of 120 percent would assume that a business has covered all operating expenses, serviced debt and has funds left over to reinvest into the business. If under 100 percent, it would mean not all operating expenses were covered and all debt wasn’t serviced. It’s important to understand how a business will cover shortages, whether it is through additional borrowing, restructuring debt, shifting to interest-only payments for a period of time or the potential sale of assets.
Debt per hundredweight
Similar to the evaluation of equity, the total amount of debt attributed to your dairy operation needs to be considered as part of your strategic plan. Historically, some looked at debt on a per-cow basis. However, with milk production varying between cows, total hundredweights shipped is more accurate. Take the total amount of debt owed – including the current portion – minus operating loans and payables in the business supported by the dairy farm and divide it by the total amount of hundredweight of milk shipped in the year.
As an example, if there is a total debt of $5 million, and operating and payables make up $400,000, and the dairy ships 55,000 pounds of milk per day, then the total debt per hundredweight is:
($5,000,000 - $400,000)/(55,000 pounds/100 x 365) = $22.91 per cwt
A typical target for a conventional (non-robotic) dairy unit is $20 per hundredweight.
The dairy in the above example would exceed those limits and may need to consider reducing debt or increasing the amount of hundredweights of milk shipped to spread the debt out over more milk. Some smaller dairy operations with larger cropping enterprises need to ensure they allocate the appropriate amount of debt to each enterprise. Total debt per hundredweight gives an understanding of the amount of debt a business can handle given its production capacity. Too much debt over too few hundredweights may pose a threat to a farm’s viability during tighter margins.
Principal and interest payments per hundredweight
Similarly, principal and interest (P&I) payments per hundredweight can be calculated to evaluate the impact on cash flows. Take the total amount of all P&I payments in a given period, divided by the hundredweights shipped, to arrive at a rate, with a target of no more than $2.75 per hundredweight. Given the above parameters, a dairy shipping 55,000 pounds of milk per day should not have more than $552,000 in P&I payments in a year. Anything above $2.75 per hundredweight places the business under cash flow strain. Restructuring debt or interest-only are options to improve this ratio, but it may also signify the business has too much debt to service given its production capacity.
Operating costs
Operating costs as a percent of gross income is the portion of income used for operating expenses. The lower the percentage, the more likely the business can withstand market fluctuations and longer periods of depressed income. The ratio can be calculated by taking the total of accrual expenses (not including interest and depreciation) and dividing the total by the accrual income total.
A total expense of $10,000,000, including $800,000 of depreciation and $400,000 of interest, and $11,000,000 of accrual revenue would position the dairy with an operating expense of 80 percent: ($10,000,000 - $800,000 - $400,000)/$11,000,000.
Cost of production (COP) is the area where managers have most control; therefore, it always needs to be evaluated. COP can help drive change and improve margins. It is important to calculate COP on an accrual basis, and feed cost, labor costs and net herd replacement cost as the three major cost drivers need to be itemized. While many operations vary in COP, below the 10-year average of the mailbox milk price received for your farm is a good starting target for where yours should be. (We’ll discuss that further in a future article.)
Conclusion
While this isn’t a full comprehensive list of ratios and metrics, it does provide the basis for an in-depth analysis of key drivers and resulting impacts that help tell the story of your dairy operation’s financial performance. Take time with your lender or consultant to review these metrics to help keep your business competitive in 2019 and beyond.