In Idaho, where the number of dairy cows has increased around 88 percent in the past 12 years, USDA scientists are collecting data on greenhouse gas emissions from dairy facilities and identifying how those emissions fluctuate daily and throughout the year.
Methane, carbon dioxide and nitrous oxide can all help trap heat in the atmosphere, and the development of particulate matter from ammonia is also a concern.
“We’ve calculated some of the first on-farm emission rates for Western large-scale dairies, along with emissions per cow and per unit of milk production,” says Agricultural Research Service (ARS) soil scientist April Leytem. “We’re performing these studies on working commercial dairies, not on experimental farms.”
Leytem worked on this project with several other scientists at the ARS Northwest Irrigation and Soils Research Laboratory in Kimberly, Idaho, including microbiologist Robert Dungan, agricultural engineer David Bjorneberg and soil scientist Anita Koehn.
For a year, the group monitored the emissions of ammonia, carbon dioxide, methane and nitrous oxide from a commercial dairy in southern Idaho with 10,000 milk cows.
The animals were mostly mature Holsteins that consumed a total mixed ration and produced an average of 75 pounds of milk per cow per day.
The facility had 20 open-lot pens, two milking parlors, a hospital barn, a maternity barn, a manure solids separator, a 25-acre wastewater storage pond and a 25-acre compost yard.
The team set out to calculate the emission rates of the four gases from three areas on the dairy facility: the open lots, the wastewater pond and the compost yard.
After they set up their instrumentation, they collected concentration data continuously for two to three days each month and recorded air temperature, barometric pressure, wind direction and wind speed. With this data, they calculated the average daily emissions for each source area for each month.
Their results indicated that, on average, the facility – animals, equipment, buildings and all – generated 3,582 pounds of ammonia, 33,162 pounds of methane and 410 pounds of nitrous oxide every day.
This came to daily emission rates of 0.3 pounds of ammonia, 3.1 pounds of methane and 0.04 pounds of nitrous oxide per cow – or 0.005 pounds of ammonia, 0.04 pounds of methane and less than 0.0006 pounds of nitrous oxide for each pound of milk produced.
The team also found that the open lots were the source of the highest levels of ammonia, carbon dioxide and nitrous oxide emissions.
These areas generated 78 percent of the facility’s ammonia, 80 percent of its carbon dioxide and 57 percent of its nitrous oxide. The lots also generated 74 percent of the facility’s methane emissions during the spring.
Generally, emissions of ammonia, carbon dioxide and nitrous oxide from the open lots were lower during the late evening and early morning, and then increased throughout the day to peak late in the day.
These daily fluctuations paralleled patterns in wind speed and air temperature, both of which generally increased during the day – and also with livestock activity, which picked up as the day progressed.
Emissions of ammonia, methane and carbon dioxide from the wastewater pond and the compost were also lower in the late evening and early morning and increased during the day.
Ammonia, methane and carbon dioxide emissions from the compost peaked during June, when the compost was frequently turned and when new manure was being added to the windrows. Methane emissions from the wastewater pond were lowest in April, when seasonally cooler temperatures prevailed, but peaked during October as temperatures rose.
“These studies will help producers meet air quality standards and help regulators determine what the standards should be,” Bjorneberg says.
“Dairy producers have been very supportive of this work,” Leytem adds. “Now we want to start improving models that state and federal regulators can use to generate estimates for on-farm emissions from commercial dairy facilities.” PD
—Excerpts from USDA website: http://www.ars.usda.gov/is/AR/2011/jul11/emissions0711.htm
A version of this article was published in the July 2011 issue of Agricultural Research magazine.
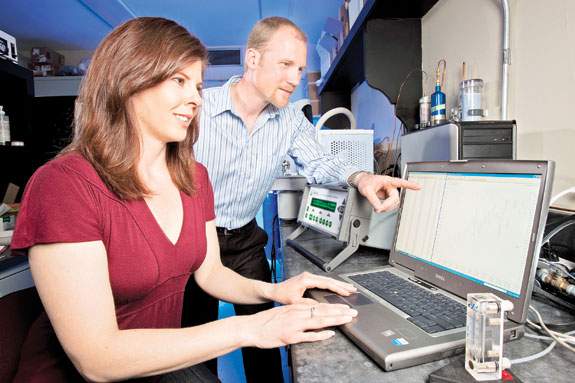
PHOTO 1:ARS soil scientist April Leytem and research leader David Bjorneberg use open-path ultraviolet-differential optical absorption spectrometry to determine ammonia concentrations at dairy operations in southern Idaho.
PHOTO 2:Northwest Irrigation and Soils Research Laboratory in Kimberly, Idaho, soil scientists April Leytem and Robert Dungan use photoacoustic field gas monitors to determine emissions of ammonia and greenhouse gases from agricultural operations.
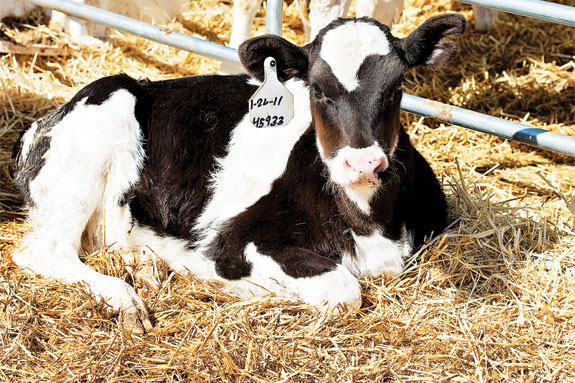
PHOTO 3:Calves at a dairy operation in southern Idaho. Photos courtesy of USDA ARS.
Ann Perry is a public affairs specialist withUSDA Agricultural Research Service. Email Ann Perry.


