The American Dairy Science Association (ADSA) Discover Conferences were established in 1997 to provide a unique environment and format for addressing important contemporary issues in food animal production. Attended by international scientists, the industry, academia, consultants, veterinarians and government representatives, there have been 21 Discover Conferences to date. I had the opportunity to attend the 22nd Discover Conference, which was on “Milk Components: Opportunities for Maximizing Farm Gate Returns and Meeting Manufacturing Needs.”
There are no published proceedings for this type of conference, but some key points came up that would be of interest to producers and their advisory teams.
Milk and dairy products for human nutrition
From the arrival of the first dairy cows in the U.S. to the Jamestown colony in 1611, milk and dairy products have become a staple of the U.S. diet.
At current per-capita intakes, dairy products are a major source of the daily nutrient requirements for protein (18 percent) and nine other essential minerals and vitamins including calcium (51 percent), phosphorus (28 percent), vitamin A (28 percent) and Vitamin D (58 percent).
Milk protein has a high biological value with a balance of amino acids as close to ideal as is possible for humans. Milk protein, mineral and vitamin intakes are a major and positive contributor to the intake of essential nutrients required in the diets of the U.S. population.
Conversely, milk and dairy product intake in the U.S. supplies only 10 percent of the daily calorie intake, so it is unlikely to be considered a contributor to the current obesity epidemic.
Equally, there is no significant evidence that dietary saturated fat of the type found in milk fat is associated with an increase in cardiovascular disease. There is also little or no data indicating that natural sources of trans-fatty acid intake, again of the sort found in milk fat, negatively impact human health.
Consumer demand
In 2009, the total pounds of milk produced in the U.S. were utilized as follows: fluid milk – 80.0 percent, American cheese – 6.0 percent, other cheese – 9.0 percent, butter – 2.3 percent, non-fat dry milk powder – 2.7 percent.
Fluid milk consumption is flat and not likely to increase much in the future. There is some increase in American cheese expected, as well as other cheeses, which include harder-style, higher milk protein-type cheeses, (higher casein-to-fat ratio).
From 2000 to 2009, milk fat utilization in the U.S. increased by 15 percent while milk protein utilization increased by 18 percent. So, milk protein use is increasing at a greater rate than milk fat, due to the purchase of harder, higher-protein cheeses and the reduction of milk fat content in fluid milk.
From a milk manufacturing standpoint, we should expect this to be reflected in milk pricing, which it has been. Since the inception of the Federal Milk Marketing Orders in January 2000, the average contribution to the Class III milk prices has been 54 percent milk protein, 41 percent butterfat and 5 percent other solids.
We can expect milk protein to continue to be highly significant in future U.S. milk component pricing.
U.S. milk pricing and the global context
Whether we like it or not, influences on U.S. dairy production are globally as well as nationally interconnected.
In terms of “risk management,” milk price risk is the biggest variable risk facing the U.S. milk producer today. Internally, the U.S. appears to have a three-year milk cycle of low and high milk prices.
This seems to reflect a “bovine generational time frame” – the time taken for producers to ramp up with extra production from incoming calved cows and heifers to take advantage of the high milk price. The result is milk surplus and subsequent lower milk prices.
This cycle can be influenced by “shocks” such as the negative supply shock of higher forage and feed ingredient prices. A positive supply shock could be increased dairy exports and a higher milk price through better Class IV prices.
Within the U.S., the Southeast is a milk-deficient area and the Northeast slightly so. Conversely, a milk surplus exists in the Midwest and West. The West, in particular, can ramp up production quickly. In effect, Western milk producers are really balancing the U.S. milk supplies in response to milk price volatility.
However, apart from Canada (which is unique in its milk pricing), the international farm price for milk (EU, Australia, New Zealand and the U.S.) is merging. This is a sobering fact and a huge challenge for the U.S. dairy industry, parts of which may not be able to reduce their cost structure as quickly as, say, New Zealand milk producers.
Regrettably, at times of future low milk price, some U.S. milk producers will not be able to cover their milk production costs, and we have had evidence of that recently in 2009.
To manage the milk price variation in a global context, U.S. milk producers need to use more risk management tools. Land ownership for production of forages and some grains is also beneficial.
The value of milk components at the farm level
Nutrient costs (like those in the Sesame computer model) can be used to assess the revenue increase from feeding for an increase in milk component production. When this is done, the value of the 87.5 lbs of water in 100 lbs of milk is zero.
Similarly the value of the other solids (lactose and minerals) is close to nil. In other words, feeding extra nutrient cost to increase milk yield without increasing milk fat and/or milk protein yield makes little economic sense. On average, increasing the milk protein test by one point is worth about 1.8 times more than raising the milk fat test by one point.
Currently, producers have very high nutrient input cost for their milk cow rations.
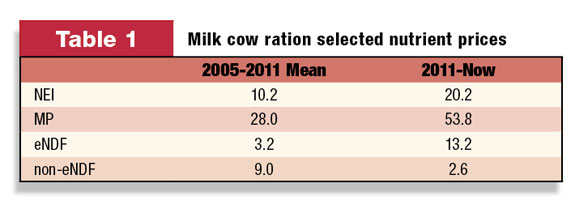
Table 1 shows nutrient prices (cents per unit) for net energy of lactation (NEL, MCal), metabolizable protein (MP, lbs), effective NDF (eNDF, lbs) and non-effective NDF (non eNDF, lbs) averaged for the period 2005-2011 compared to current prices right now.
For example, the current nutrient price per Mcal of NEl is 20.2 cents and this is close to two times higher than the average of the previous six years. MP at 53.8 cents per pound is also 1.9 times higher than before.
Physically effective NDF (a must-have for rumen function and rate of passage control such as straw and long-stem hay) now costs 13.2 cents per pound and is four times higher than previously. Non-eNDF (such as corn gluten feed, distillers grains, citrus pulp and soy hulls) are the “bargains” up to safe inclusion rates in the ration.
The bottom line is milk producers currently have historically high NEl, MP and eNDF nutrient prices covered by 2011 milk component price returns which are similar to those of 2008. Dairy producers should consider more price risk management and put it in place in advance.
Feeding for milk protein: Economics and environment
Balancing milk cow diets for optimal amounts of lysine and methionine in the presence of sufficient rumen-fermentable carbohydrates and rumen-degradable protein (RDP) has realized increased milk component contents, increased milk yield in early lactation cows and reduced ration rumen-undegradable protein (RUP) content.
Accepting low on-farm milk components because of “high production” appears to be an excuse for less-than-optimal milk cow nutrition.
Lower RUP milk cow rations offer the opportunity for improvements in on-farm nitrogen (N) efficiency. The theoretical limit for N efficiency in lactating dairy cattle is 40-45 percent. As N intake increases, more is lost in the urine; the transfer to milk N and loss in fecal N is only marginally increased.
Some U.S. farms are now achieving 40 percent N efficiency using “lower” protein rations, with very good feed management and minimal variation in milk cow nutrient supply. The goal is to meet rumen N needs in the presence of the correct type and range of rumen- fermentable carbohydrates and make sure the amino acid supply of the metabolizable protein is optimized.
Milk urea nitrogen (MUN) runs at 8.0 to 10.0 mg per 100 ml on these lower N rations. Current research suggest 6.0 mg per 100 ml could be the lower limit for MUN where the rumen runs out of N for microbial yield.
Milk fat, bio-hydrogenation and conjugated linoleic acid
The biology of milk fat depression is increasingly better understood in terms of specific bio-active fatty acids produced under altered rumen conditions. These bio-active fatty acids are potent inhibitors of mammary lipogenic enzymes, so they reduce milk fat content.
Unsaturated fatty acids from high fat or oil feeds in a dairy cow ration are bio-hydrogenated to saturated fatty acids by rumen microbes to make them less toxic to the rumen environment. Under “normal” rumen conditions, the fermentation pathway produces intermediates that are not disruptive to milk fat syntheses in the mammary gland.
However, under abnormal rumen conditions (for example, sub-acute rumen acidosis – SARA), an altered pathway is used by the bugs to produce bio-active intermediates.
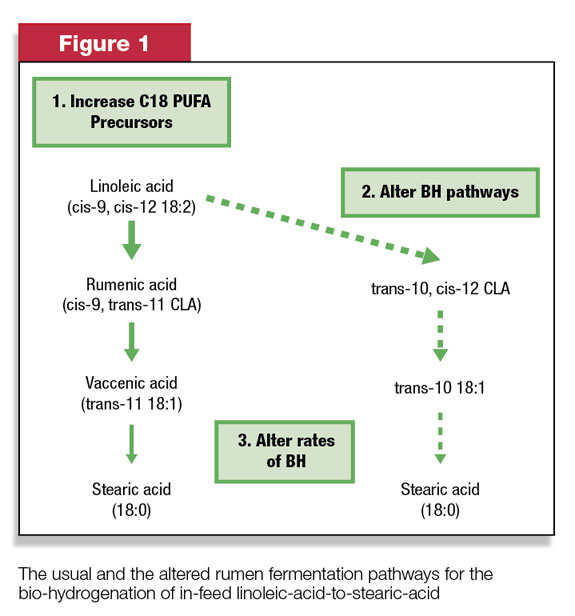
These two pathways are summarized for the unsaturated fatty acid linoleic acid in Figure 1 .
Linoleic acid is very common in U.S. milk cow rations from the oil/fat in such ingredient sources such as corn products (corn silage, shell corn, distillers grains) and soy products (roasted soybeans).
The left-hand side of Figure 1 shows the usual pathway of linoleic bio-hydrogenation to stearic acid via rumenic and vaccenic acid. No milk fat depression (MFD) will occur.
However, on the right-hand side of Figure 1, under abnormal rumen conditions, (for example, SARA), an altered bio-hydrogenation pathway is used by the surviving rumen bugs, and they produce the potent milk fat inhibitor trans-10, cis 12 conjugated linoleic acid, (t10;c12-CLA).
Only 1.0 to 2.0 grams daily of bio-active t10;c12-CLA entering the mammary gland via uptake from the small intestine can reduce a cow’s milk fat by four points.
Once t10;c12-CLA is produced it only takes two to three days to significantly reduce milk fat content. Once the problem is identified and corrected, it can take up to seven to 15 days for milk fat content to get back up to normal.
Risk factors for MFD from t10;c12-CLA are a combination of nutrition, feed management, cow physiological state and the environment. However, the more common on-farm contributors to be aware of are: too much unsaturated fat/oil in the ration, small forage particle size, too much rumen fermentable starch, antimicrobials, (e.g. Rumensin), wild yeasts, low rumen pH and SARA.
There are combination interactions where Rumensin per se is not a problem, but combined with a change to a new ration containing small forage particles (low eNDF) with too much fermentable starch causes more t10;c12-CLA to be produced in the rumen.
Since we cannot take all the linoleic acid out of U.S. diets (e.g. corn silage, corn grain, distillers, roasted soybeans, whole cottonseed, etc.), we need to recognize rumen pH management is a potent regulator of rumen t10;c12-CLA production.
The more we can provide excellent dairy nutrition with top-shelf on-farm feed and cow management, the more we minimize SARA and t10;c12-CLA production in the rumen.
Some nutritional allies in the management of the rumen and cow metabolism to tip the balance in favor of less SARA, less t10;c12-CLA and more milk fat content include:
• Effective direct-fed microbials with a track record of increasing rumen pH
• Positive DCAD rations particularly with potassium carbonate inclusions
• Better antioxidant intakes for dry and milking cows
• Targeted specific fatty acid feeding of C16:0 (Palmitic acid)
As always, new information gives us better insight into the challenges we face, and what the dairy advisory team should focus on for the future. The three clear take-home messages were:
• There is no guarantee of high milk prices and likely less regulation. Do not become a milk price victim in the future – make time for a milk price risk management plan with your team and implement it!
• For those on milk component-based contracts, make sure you are doing all you can to leverage the best milk protein yield from your rations and feed management. At the same time, all farms – whether on fluid or component pricing – should look over their current feed practices to save on ration-N (CP) and get MUNs down.
• Where milk fat content is paid for, make sure the team is doing all that it can to minimize the conditions for t10;c12-CLA production and achieving the best milk fat content for the ration fed. PD
Tony Hall
Dairy Technical Services Manager
Lallemand Animal Nutrition


