The dairy industry is always changing. Shifting consumer tastes, advances in technology and increasing exports drive the current changes. Less fluid milk is consumed, more cheese is consumed, more Greek-style yogurt is consumed, and more low-moisture products such as nonfat dry milk are exported. Today’s dairy growth markets all need dairy components, not water.

The good news is that components are increasing. In the last five years, average butterfat has increased from 3.67 percent to 3.76 percent, and milk protein has increased from 3.06 percent to 3.12 percent. During this time, somatic cell count has been reduced from 266,000 cells per milliliter to 213,000 cells.
However, there is one qualitative issue about milk that is not being aggressively addressed – the seasonal loss of component production. Most everyone has been aware of it for a long time, but it is rarely quantified or defined. Maybe it is so common that it is often just accepted and overlooked. There is limited research being done to define this problem or find solutions or partial solutions.
Every summer, the percentage of protein and butterfat in milk decreases. What does this cost the industry? At least a billion dollars a year. Additionally, the drop in components during the summer months is getting worse, not better.
Ever considered just how much butterfat production falls?
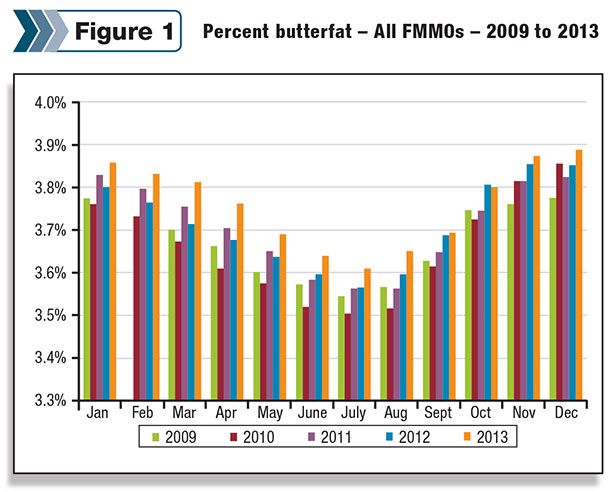
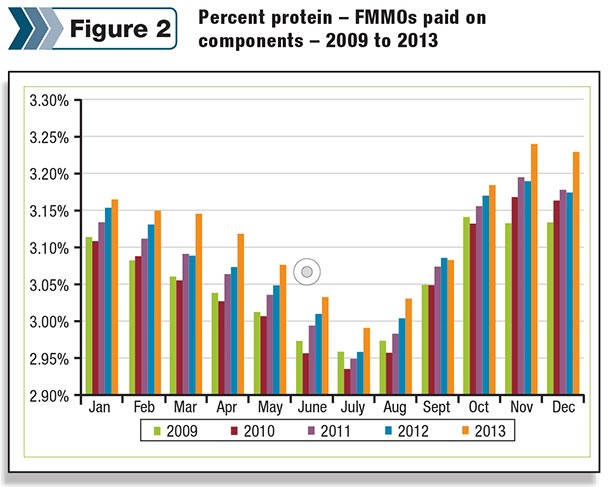
The problem, or at least the symptoms, can be quantified. Each and every year, butterfat and milk protein follow a similar pattern. In the summer, both drop significantly from their winter highs. Figures 1 and 2 are based on the most recent five years (2009-2013). However, even if the time periods shown were extended, the same patterns would be evident far earlier than just 2009.
The information shown here is based on data from the Federal Milk Marketing Order (FMMO) database. This source was chosen because it covers the majority of milk produced in the U.S. and the data is collected in a consistent manner with reasonable accuracy.
Butterfat follows a very predictable pattern of reaching highs in November, December or January, and lows in June, July or August. This pattern is the same in each of the 10 federal orders. The depth of the drop is reasonably consistent in eight of the 10 federal orders. The other two orders follow the same pattern but are outliers in terms of the magnitude of the decrease.
How big is the drop? On the average, butterfat drops 0.28 percent from the highest butterfat test month of the year to the lowest test month of the year. That may not seem like much if compared to the five-year butterfat average of 3.7 percent. However, this drop in butterfat production represents a loss of 280 million pounds of butterfat every year.
Based on the U.S. population of 317 million people in the U.S. and a standardized USDA butterfat-to-butter conversion, that volume of extra butterfat could increase butter availability by about 1 pound per person annually. While this extra volume of butterfat would probably be exported, not consumed, this illustrates the significance of the loss.
Milk protein follows a similar pattern
Value for protein is paid in six of the 10 Federal Milk Marketing Orders and is therefore recorded in the FMMO public database for these orders. From the peak to the lowest month, the variation in milk protein is 0.23 percent, similar to that of butterfat’s variation.
Average milk protein production in milk was 3.08 percent, and it ranged from a monthly high in the winter months of 3.20 percent to a monthly low in the summer of 2.97 percent. Again, this is a very significant loss.
Other milk solids do not fluctuate much during the year. While there are slight variations, they do not follow any seasonal pattern and appear to be small, naturally occurring variations. Other milk solids contribute much less to the producer’s revenue than butterfat or milk protein, representing a much smaller loss in revenue potential.
Variation costs $1 billion annually
U.S. dairy producers are all paid for at least one of the same components in their milk – butterfat. In California, producers are paid based on pounds butterfat and non-fat solids.
In federal orders, producer payments are issued based on pounds of butterfat and pounds of skim milk. Most other producers who are not part of a government-structured payment system are paid by methods similar to the FMMO systems.
If in the summer months, butterfat and protein production lows did not decline as they do now, producers could increase revenue by more than $1 billion. See Table 1 for details.
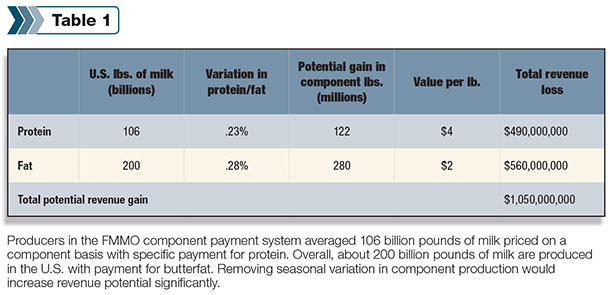
This billion-dollar opportunity accounts only for lost revenue. While protein is not specifically paid for in approximately 50 percent of the U.S. market, that protein is lost in the entire market. In reality, U.S. protein production loss is probably calculated closer to 230 million pounds annually. Trends show that the problem is increasing, not decreasing.
What’s causing it? Can this be improved?
The most commonly stated reason for the drop in components is heat stress. Other possible causes include daily hours of sunlight, new-crop feed versus old-crop feed, lactation cycles and hormonal balances.
With the talent of dairy professionals, the leadership of dairy managers, and with a concentrated multi-disciplined effort, improvements could certainly be made. The contributions could come from genetics, nutrition, engineering and management. Can engineers design low-cost cooling?
Can housing be better designed to keep temperatures lower? Should observed daylight be limited to fewer hours in the summer? Can nutritionists design special diets for hotter weather? Can genetics be altered to make cows less sensitive to heat?
Recapturing even a portion of this revenue would be a spectacular benefit to the U.S. dairy industry. Compared to the size of the problem, there is minimal research being done to define the reasons for this variation and to develop solutions.
A more detailed look at some of the data may be useful in understanding the most discussed culprit, which is heat. (See Table 2 ) A look at the data geographically shows a lot of similarity among the FMMOs, with two orders that are outliers. The temperature data is from the U.S. climate database and is matched to the areas of high dairy cow concentration in each federal order.
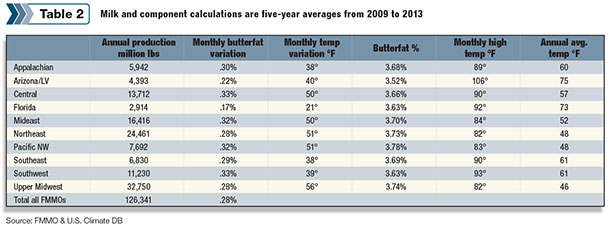
The two outliers are Florida and Arizona. Both are well below the butterfat levels of the other eight orders. Both Florida and Arizona are paid on the advanced system, which only pays for butterfat, not protein or other solids. Protein follows the same patterns as butterfat, but protein is not recorded for Florida or Arizona, so data on protein is not available.
Florida is unique in that it is surrounded by water on three sides. This tends to keep temperatures less variable throughout the year. From monthly highs to monthly low temperatures, there is only a 21°F difference in Florida, about half of that of more inland FMMOs.
Florida also has the second-highest annual temperature in the list, with annual average temperature of 73°F. This indicates a correlation between high temperatures and low butterfat but does not help us understand the causation.
Arizona/Las Vegas is the warmest FMMO. The monthly high of 106°F and an average annual temperature of 75°F are certainly correlated with the lowest butterfat level in the FMMO system.
The low butterfat levels for Florida and Arizona would support the concept that heat stress is the main culprit or at least a significant contributor behind reduced components levels.
Money and effort often follow a path where there are profit opportunities. Addressing the seasonal drops in milk component levels should be one of those great profit opportunities. PD

John Geuss
Independent Dairy Consultant


