The USDA’s latest Milk Production latest report was released on March 18, providing preliminary February estimates and revised January totals. When compared to last year, February 2021 U.S. and major dairy state average milk production and milk output per cow estimates come with asterisks: 2021 estimates must be adjusted due to a “leap day” in 2020.

So while on the surface monthly year-over-year milk production declined in February, such is not the case when adjusting for one fewer day of production in 2021.
February 2020-21 recap at a glance
Here is a review of the USDA preliminary estimates for February 2021 compared to February 2020 (with some adjustments for leap day in 2020*):
- U.S. milk production: 17.63 billion pounds, up 2%*
- U.S. cow numbers: 9.458 million, up 81,000 head
- U.S. average milk per cow per day: 66.6 pounds, up 0.8 pound
- 24-state milk production: 16.82 billion pounds, up 2.3%*
- 24-state cow numbers: 8.936 million, up 88,000 head
- 24-state average milk per cow per day: 67.2 pounds, up 0.8 pound
Source: USDA Milk Production report, March 18, 2021
The latest report also revised January’s milk production total higher, adding another 150 million pounds (0.8%) to last month's preliminary estimate. That means production growth, thought to be subdued at just 1.6%, instead increased 2.4%.
Cow numbers continue climb
At 9.458 million, February 2021 U.S. cow numbers were up by 3,000 head from revised January numbers, which were also raised another 5,000 from last month’s preliminary report. In the 24 major dairy states, cow numbers were up about 2,000 head from a month earlier. Since bottoming out in June 2020, U.S. and major state cow numbers are up about 100,000 head.
Compared to a year earlier (Table 1), February cow numbers were reported higher in 13 states and lower in 10 states, with New York again unchanged.
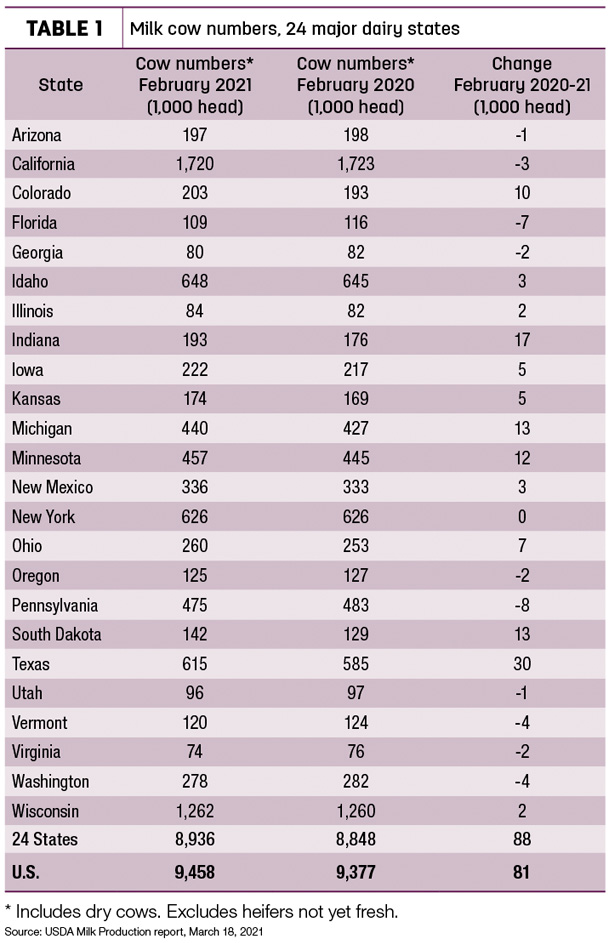
Texas led all states in growth in cow numbers, up 30,000 head from the year before and nearly offsetting the combined 34,000-head decline in Arizona, Utah, Georgia, Oregon, Virginia, California, Vermont, Washington, Florida and Pennsylvania. The combined growth in Texas, Indiana, Michigan, South Dakota, Minnesota and Colorado totaled 95,000 head from the year before. Florida and Pennsylvania showed the biggest drop from a year earlier, down 7,000 head and 8,000 head, respectively.
Weekly dairy cull cow slaughter in 2021 is now running slightly ahead of rates during corresponding weeks a year ago. Through March 6, weekly slaughter under federal inspection had surpassed year-earlier levels in seven of the first 10 weeks, with overall slaughter (660,200 head) up about 8,700 head over that period. The USDA weekly cow slaughter data is updated on Thursdays and generally includes a two-week lag.
What about Texas?
The other wildcard in the monthly milk report is the impact from February’s Winter Storm Uri, primarily in Texas. Based on the USDA’s Milk Production report, Uri temporarily stunted but didn’t halt ongoing growth in the Lone Star State.
Without leap day adjustments, Texas production was still up 20 million pounds from the year before, an increase of about 1.7%. Factoring in leap day in 2020, 2021 production was up more than 2 million pounds per day, an increase of about 5.3% on a daily basis. The month’s milk production totals put Texas and New York in nearly a dead heat for fourth place among major dairy states, at least for February.
Although the full impact of damaging mid-February winter storms is still being determined, regional milk production was picking up in Texas and neighboring states, while dairy cow culling was also on the rise. Contacts with USDA’s Dairy Market News suggested animal health issues caused by the weather were leading to increased cow culling.
Latest available USDA Region 6 cow culling data estimated about 19,000 dairy cows were slaughtered under federal inspection for the weeks ending Feb. 27 and March 6, up about 4,800 head from the comparable weeks a year earlier. The region includes Arkansas, Louisiana, New Mexico, Oklahoma and Texas.
For the same time frame, dairy cull cow slaughter totals were also up about 3,000 head in the USDA Region 7, covering Iowa, Kansas, Missouri and Nebraska.
Some of the ongoing increase may be attributed to livestock market disruptions also caused by the winter storms, with sales catching up from trucking delays and market closures in mid-February.
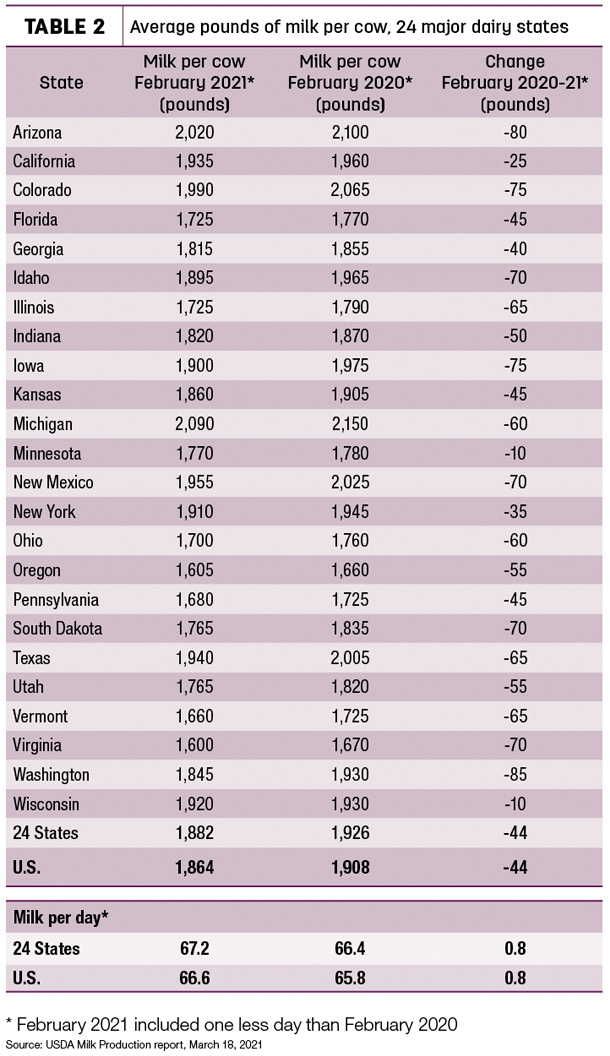
Milk per cow up on daily basis
When calculated on a daily basis, U.S. and 24-state milk production per cow was up about 0.8 pounds (1.2%) compared to last year (Table 2). Compared to a year earlier, output per cow per day growth was highest in Wisconsin, up 2 pounds, followed by Minnesota (1.8 pounds) and California (1.5 pounds).
Michigan remained the nation’s leader in milk per cow no matter how you measure it.
Milk volume, percentages
Without adjustments for leap day, Indiana led the seven states with year-over-year milk volume growth in February, up 22 million pounds (6.7%). On a percentage basis, February 2021 output in South Dakota was up about 6% from a year earlier. Florida (-8%) and Vermont and Virginia (each -7%) again led decliners.
When adjusting for leap day, Indiana and South Dakota milk production grew by about 10% on a daily basis to lead all states, with Minnesota up nearly 6%. Florida production was down 5% on a daily basis.
Cropp shares outlook
Bob Cropp, dairy economics professor emeritus at the University of Wisconsin – Madison, provided an overview of dairy markets in his monthly Dairy Situation and Outlook report. He said milk production for the remainder of the year will be a major factor affecting milk prices.
The USDA’s latest forecast has milk cow numbers averaging 57,000 head (0.6%) more than a year ago. With milk per cow expected to average 1.2% more than 2020, that results in 1.8% more milk for the year. “This is a lot of milk considering last year was leap year,” he said.
Favorable milk prices will require improved domestic sales and strong exports. While there are positive signs on the demand side, the outlook remains uncertain, Cropp said.
“Restaurants in some states are being allowed to expand indoor dining, and some schools are allowing the partial return of students. This is already showing improvement in food service sales which is positive for butter and cheese prices,” Cropp said. “Hopefully, by fall restaurants and schools will be operating more to normal.”
Dairy exports are forecast to stay relatively strong for nonfat dry milk and skim milk powder, with exports of butter and whey products also expected to increase. Port congestions, container shortages and labor shortages stemming from trade imbalances created by the pandemic undercut dairy exports last year. This situation is expected to improve, he said.
On the downside, stocks levels are relatively high and need to be worked down, Cropp said. The fifth round of the Farms to Families Food Box program expires in April, and the level of government purchases is not likely to be at the level of last year to support milk prices.
Current Class III dairy futures have recently weakened some but are still fairly optimistic, Cropp said. Class III futures reach the low $18s by June and stay there through November. Those prices provide some opportunity for dairy farmers to protect more favorable milk prices with Class III futures or options or using the Dairy Revenue Protection (Dairy-RP) program. With feed prices higher than a year ago, protecting milk prices is important, he said.