While anti-dairy advocates and the dairy industry itself focus on declining fluid milk sales, there’s good dairy news: Latest USDA data shows 2016 U.S. per capita consumption of dairy products (on a milk-equivalent, milkfat basis) rose 16 pounds, the second-largest annual jump dating back to 1975.

The only year per capita consumption took a larger jump was 1982-1983, a period when the USDA’s Commodity Credit Corporation purchased and distributed large volumes of dairy products under the dairy price support program. The two-year (2015-2016) per capita increase of 30 pounds (milk equivalent/fat basis) was also the largest two-year increase dating back to 1982-1983.
Cheese consumption sets record
Making up for the decline in fluid consumption is cheese, butter and yogurt. Per capita U.S. cheese consumption in 2016 was a record 36.62 pounds, up 1.25 pounds (3.5 percent) from 2015 and the sixth consecutive record-setting year (Table 1).
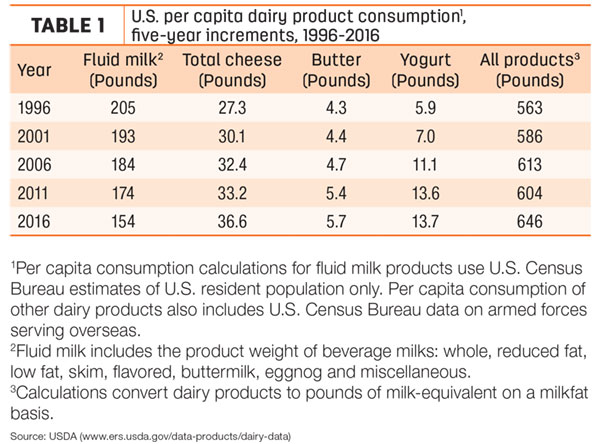
Per capita cheese consumption has increased 9.68 pounds since 1995. Last year was the first time since 1999 that per capita cheese consumption jumped by more than a pound in a single year.
Of total cheese consumption, nearly 31 pounds was consumed as natural cheese, with the remaining consumed as processed products (processed cheese, cold pack cheese foods and spreads) with a cheese content of 5.75 pounds per person.
In 2016, per capita consumption of American-type cheese totaled a record 14.31 pounds. Within the American cheese category, per capita cheddar consumption was 10.37 pounds in 2016, the highest level since 2006. Per capita consumption of other American-type cheeses was 3.94 pounds.
For other-than-American cheese (excluding cheese not made from cows’ milk), per capita consumption last year was a record 22.03 pounds, up 0.98 pounds from 2015. Last year, cheeses other than American-type accounted for about 60 percent of total per capita cheese consumption.
Per capita Italian cheese consumption was a record 15.19 pounds in 2016, up 0.72 pounds from 2015. Within the Italian cheese category, mozzarella consumption was a record-high 11.72 pounds per person, and consumption of other Italian cheeses was a record 3.47 pounds, up 0.27 pounds from 2015.
Among other types of cheeses: Muenster, cream and Neufchatel, blue and Gorgonzola, Hispanic and “other” cheeses posted small gains, but per capita consumption of Swiss and Brick declined slightly.
Annual per capita butter consumption has held steady or increased every year since 2011, hitting a new high of 5.7 pounds per person since 2016.
Although per capita yogurt consumption declined in both 2015 and 2016, to 13.7 pounds per person, it’s still about seven times higher than 1975.
Consumption patterns of dry products (dry whole milk, nonfat dry milk, dry buttermilk and dry whey and whey protein concentrates) have shown only small changes over the past 40 years.
Consumption of evaporated and condensed milk products have been fairly consistent over the past two decades. Frozen products, including regular and reduced-fat ice cream, sherbet and other frozen products, have held steady for the past five years.
Fluid consumption decline a concern
No doubt about it, declining fluid milk consumption is a concern. Per capita consumption has declined fairly steadily over the past four decades, from 247 pounds (31 gallons) per person in 1975 to 154 pounds (19.25 gallons) per person in 2016.
And, the rate of decline has picked up speed. Per capita fluid milk consumption declined at an annual rate of 0.9 percent between 1995-2010, but dropped at an annual rate of 2.6 percent between 2010-2015. Through the first eight months of 2017, monthly USDA reports have estimated sales of all fluid milk are running about 2.2 percent behind the same period in 2016.
Although small in comparison, plant-based milk alternatives are making marketing inroads, according to a USDA Economic Research Service report (“On Different Trajectories: A Look at Sales of Cow's Milk and Plant-Based Milk Analogs,” Sept. 18, 2017).
While USDA reports annual data on cow’s milk consumption, it does not collect data concerning plant-based alternatives (almond, soy, coconut, cashew, rice and other plant-based beverages). To evaluate dairy and plant-based beverage consumption, the USDA ERS study used scanner data from Information Resources Inc. (IRI).
The study showed the market share of cow’s milk versus plant based beverage products declined about 2 percent from 2013 to 2015.
In 2015, IRI data show that 92.2 percent of consumers bought cow’s milk and 32.2 percent bought a plant-based alternative at some time during the year. About 90 percent of households who bought one or more of the alternative beverages also bought cow’s milk. Only 3.3 percent of households bought one or more alternatives but no cow’s milk.
If it’s any consolation, the pace of total and per capita consumption appears to have slowed, thanks in part to a rejuvenation of whole, flavored whole and whole organic milk.
One other point of interest: Organic milk sales now represent about 5.4 percent of total fluid consumption. ![]()

-
Dave Natzke
- Editor
- Progressive Dairyman
- Email Dave Natzke


