Editor’s note: This is the third part of a three-part series. Management practices related to cropping and feeding can be major factors affecting the animal performance to maintain a sustainable profit margin.

In part one of this series (Corn silage, feeding management, cash-flow effects), data illustrated the variability of forage quality when hybrids were blended in the storage structure compared to feeding a single hybrid. Frequent testing of both fiber and starch digestibility is one strategy to manage the variability of corn silage.
In part two of this series (Corn silage, feeding management ane economic effects), data demonstrated how implementing various ensiling and feeding management practices relate to milk production. The question then becomes: How do these management practices and silage variability influence an operation’s profit margin?
The Penn State Extension Dairy Business Management Team has been assessing 46 farms for their actual cost of production for the past three years to determine within-year and across-year variation.
This project had the advantage of capturing information in an average milk price year (2013), a spectacular year (2014) and a depressed year (2015). Figure 1 shows the distribution of income over feed cost (IOFC) for 46 producers who provided financial data for all three years.
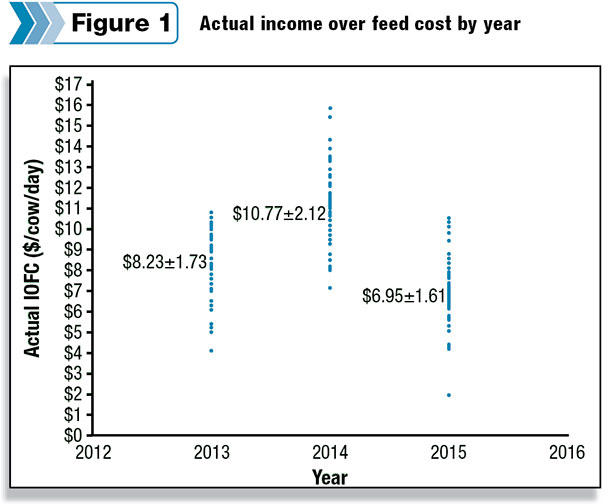
IOFC was chosen to evaluate profitability because it encompasses three major components: milk price, milk production and feed cost. The milk cow feed cost included both home-raised and purchased feed costs. There are differences in average IOFC among years, which is expected given the volatility of milk and feed prices.
The variation in IOFC within a given year demonstrates the potential for producers to control feed cost and production to achieve a greater profit margin. Similar yearly variation was seen in milk price and milk cow feed cost.
Evaluating one year’s financial data can be very misleading, so this study spanned multiple years to get a more accurate assessment of financial performance over time.
To assess herds with repeated successful performance, herds in the top 25 percent and bottom 25 percent for a given year were identified. The analysis was restricted to the dairy enterprise (including home-raised crops going to the dairy enterprise) for a more objective comparison.
Three-year averages for various metrics were calculated for herds in the top 25 percent all three years, herds in the bottom 25 percent all three years and herds that fluctuated from year to year (Table 1). The bottom 25 percent had higher average milk cow feed costs, lower production, slightly lower average milk price and, thus, lower IOFC than either of the other groups.
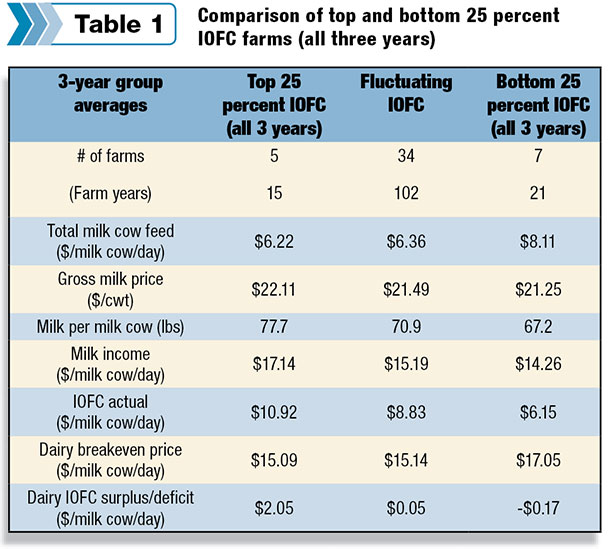 Average feed costs between the fluctuating herds and the top 25 percent were relatively similar. Milk price averages were higher in the top 25 percent. This could potentially be a reflection of better components and milk quality.
The biggest difference observed was milk production. Despite similar feed costs, production in the fluctuating group averaged nearly 7 pounds less per milk cow than the top 25 percent, thus keeping them from realizing greater profit margins.
The next step was to evaluate how the actual IOFC compared to a herd’s breakeven number. The bottom of Table 1 lists the three-year averages for each group in terms of their dairy breakeven per cow and their dairy IOFC surplus or deficit.
Herds in the bottom 25 percent averaged higher breakeven prices than the other two groups and, combined with their low IOFC, had a deficit per milk cow per day for the three-year average. The top 25 percent and fluctuating group had similar breakeven prices, but with their higher IOFC, the top 25 percent herds averaged $2 greater surplus than the middle group.
Producing high-quality home-raised feeds and implementing feed management practices was shown to influence milk production. Table 2 depicts how the top and bottom 25 percent for IOFC in 2015 compared in their implementation of ensiling and feeding management practices.
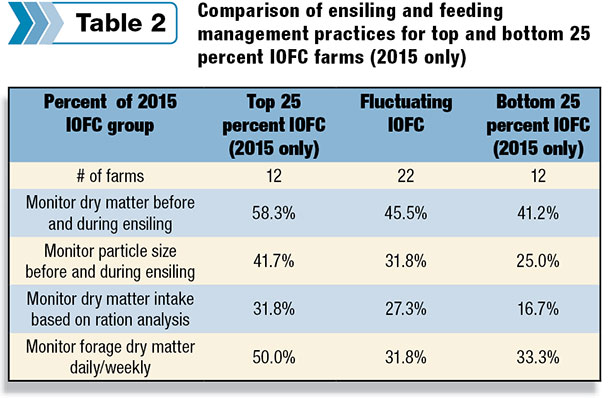
The top 25 percent had the highest percentage of within-group implementation for the feeding management practices. For example, 42 percent of the top 25 percent herds monitored particle size before and during the ensiling process, while only 25 percent of the bottom 25 percent herds implemented the same practice.
As noted in the overall feed management evaluation, implementation of these practices is probably an indicator of good overall management, which contributes to higher animal performance and greater profit margin.
Corn silage quality and management was evaluated in the top- and bottom-performing herds. The top 25 percent for 2015 tended to have slightly better corn silage in terms of dry matter percent, seven-hour starch digestibility and 30-hour neutral detergent fiber digestibility, both in the fall and spring sampling periods.
They also fed a higher amount of corn silage on a dry matter basis. During the next phase of this project, a more complete analysis of corn silage within the ration will be analyzed with the addition of actual dry matter intakes and an analysis of the TMR.
Investigation into corn silage production and harvest practices and their influence on the ration and farm profit margins will be further examined by the extension dairy and crops teams.
Monitoring corn silage for quality variation and overall ensiling and feeding management practices were identified as key components to ensure strong animal performance and farm profitability. Changes in management and their impact on farm profitability may go unnoticed if the farm does not routinely monitor their individual financial performance.
Metrics such as IOFC can help herds understand their financial position but are of limited value without their breakeven cost number. There is no one management practice that results in a positive profit margin; it is the interconnection of the management practices related to cropping and feeding that influence the margin.
Monitoring key metrics and implementing sound management practices help keep dairy producers sustainable, even during difficult times. PD
Rob Goodling, Jr., Timothy Beck and Heather Weeks are part of the Penn State Extension Dairy Team.

-
Virginia Ishler
- Penn State Extension Dairy Team
- Email Virginia Ishler