
As a child, I would spend hours at a time putting together puzzles. Although I don’t have nearly the time to dedicate to puzzles as I once did, I still enjoy spending a few hours putting all the pieces together.

It reminds me of the way we piece together different aspects of a dairy ration in order to optimize the nutrition supplied at the best cost. There are a few differences between a ration and a puzzle – one being that this dairy ration puzzle is constantly changing, and we cannot simply put it together and walk away.
Thankfully, as the industry has continued to grow and evolve, we have developed tools that can help us pull the pieces together in feeding cows. Nutrition-balancing models are one such valuable tool. They help us to better understand and quantify the needs of the animal along with the balance of feeds and nutrients they supply. Models are important; however, other tools exist that can help alongside the models.
What kind of puzzle are we putting together?
Understanding what animals and conditions we are balancing a ration for helps quantify the nutrient requirements. Breed, age, production level, size and activity patterns, environmental conditions and housing situations are also important elements to consider. These variables help us better understand the unique metabolic needs for each group and better portray what kind of puzzle we are assembling. Modern technology has greatly advanced our ability to accurately measure these parameters, allowing us to further refine the estimated metabolic requirements. For example, pedometer technology can help us better estimate standing and lying behaviors.
Research has shown that each additional hour of lying time has resulted in 2 to 3 more pounds of milk produced. Pedometers can help us refine milk production estimates by providing more accurate behavioral data. Similarly, Google Earth can determine distances between pens and the milking parlor, which helps estimate the walking distance to input – if the model allows for this. Some models take these inputs into account when calculating the nutrient requirements of an animal, and these are beyond feed analyses and nutrient balancing. Just as we often dig out the corner pieces first in a puzzle, I like to think of this animal and environment step as creating the cornerstones of our ration.
Laying the framework
After we have identified the corners, we often move on to the edges, which in this case represent what feeds we have available: the feed prices and feed inventory. The model doesn’t tell us what we can and cannot use, but frequent communication with the dairy management team will help understand what and how much of each feed can be fed. This is an important step as we put together the framework of our ration.
Fitting all the pieces together
Once the frame is built, I start grouping pieces by colors and patterns. Depending on how complex the puzzle, there are often upwards of 10 different puzzle piece piles. The dairy nutrition puzzle is a complex one and, as a result, I like to group the nutritional and environmental aspects together.
The nutritional-balancing groups include these four different piles – proteins, carbohydrates, fats, minerals and vitamins. Nutrient content as well as digestion kinetics play a huge role in balancing the groups. It is imperative to accurately define these feed parameters if we wish to accurately model around them.
Models such as the Cornell Net Carbohydrate and Protein System (CNCPS) have extensive feed libraries; however, even the best software databases cannot capture recent nutritional trends. We often test our forages frequently, understanding that forages vary based on a multitude of factors. However, our commodities can vary as much as forages. Many do not recognize this economically impactful fact. Figure 1 showcases how much variation we can see in a feed such as canola meal and how it compares to two different feed library values (shown as black lines).
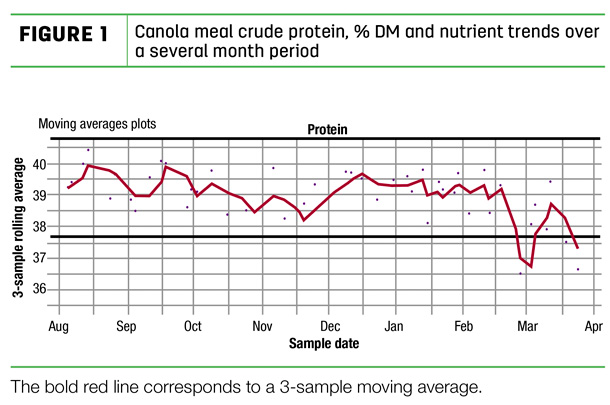
If the ration was balanced based on the crude protein (CP) value corresponding to the lower black line in Figure 1, CP may be oversupplied compared to what the cow requires. This can lead to a more expensive ration than necessary. On the other hand, if the ration is balanced on the upper feed library value, while in actuality the canola meal is lower in CP, cows may not produce as predicted due to a lower-than-expected CP level in the total mixed ration (TMR).
Bear in mind that a frequent sampling program is necessary to capture the CP changes in canola meal over time. Using a three-sample average creates a clear way to establish trends over time and overcome any variation due to sampling error. Canola meal is an example here, but the same can be said for soybean meal or other purchased feeds.
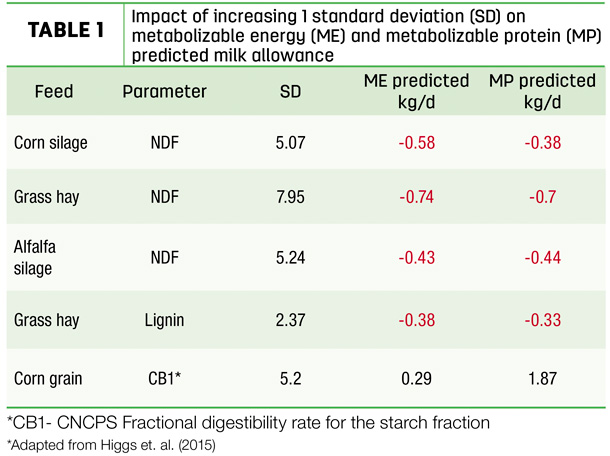
Creating a frequent sampling program allows us to quantify the variability in feeds and use this information in models to generate more accurate predictions. To more accurately assess how this feed variability impacts model predictions, one study looked at the impact of increasing one standard deviation (SD) in many common nutrition parameters on predicted metabolizable energy (ME) and metabolizable protein (MP) allowable milk production in the CNCPS model. SD is a mathematical equation commonly used to better quantify the variability in feed. Table 1 showcases how small changes in these nutrient parameters can lead to large differences in predicted milk production.
Frequent feed testing is an important tool that allows us to more accurately define not only feed dry matter but also feed nutrient fractions which are, as demonstrated above, critical in maintaining accurate model predictions. By providing rapid results, a low-cost near infrared reflectance spectroscopy (NIR) forage analysis provides us the ability to more frequently test feeds, identify meaningful trends and then intervene when necessary to adapt to changes within the feeds.
Coming back to the puzzle, as we lay out groups of similar pieces, visual herd observations and monitoring are also critical to making everything fit together. Once a ration has been formulated to our liking, we need to work and ensure the formulated diet is actually consumed as expected and then yields the anticipated outcome. It is important to monitor performance, keeping a close eye on changes in body condition score (BCS), eating behaviors, shaker box results and fecal scores, as well as periodic fecal starch measures. These cow level observations are key areas that can be overlooked when balancing a ration.
Models are a valuable tool in many different ways. They help to organize all the inputs and understand the potential outcomes, and they can also help us to identify an issue when production is vastly different than expected. However, they are just one piece of how a nutrition program fits together, and it is important to use all the tools available when solving the whole nutrition puzzle.